- Transformation Plan On Track; Actions Taken-to-Date Have Driven Over $33 Million in Annualized Run-Rate Cost Savings
- Total Cannabis Net Revenue, Net of Provisions, Grew ~10% to $60.1 million Compared to $54.8 Million in Q4 2021
- Adjusted EBITDA Excluding Restructuring Costs Improved by $4.0 million to a loss of $11.5 million versus Q4 2021; Clear Pathway to Adjusted EBITDA Profitability by H1/FY23
- Improved Adjusted Gross Margin before FVA of 54% versus 53% in Q4 2021
Aurora Cannabis Inc. (the “Company” or “Aurora”) (NASDAQ: ACB) (TSX: ACB), the Canadian company defining the future of cannabinoids worldwide, today announced its financial and operational results for the first quarter fiscal 2022 ended September 30, 2021.
“Our transformation plan is on track. We continue to strengthen and transform our business while benefitting from broad diversification across our international medical, domestic medical, and adult recreational segments. On a run-rate basis to date, we have executed over $33 million in annualized cost savings and are positioned to deliver approximately $60 to $80 million in aggregate across selling, general and administrative (“SG&A”), production, facility and logistic expenses upon the completion of our business transformation. Our strong Adjusted gross margins and narrowing Adjusted EBITDA loss are also providing us with a clear path to profitability by the first half of fiscal 2023 as we position ourselves for long-term success. Importantly, our robust balance sheet and working capital support our organic growth plans, and provide us with the financial flexibility to evaluate accretive M&A opportunities,” stated Miguel Martin, Chief Executive Officer of Aurora Cannabis.
“During the quarter, total cannabis net revenue increased by approximately 10% sequentially, driven by our industry leading and high margin global medical cannabis business. Our premiumization strategy also gained traction, as evidenced by 29% sequential revenue growth in our premium dry flower brands of San Rafael ’71 and Whistler, primarily driven by the launch of three new Coast cultivars,” he continued.
“Our regulatory and compliance expertise in medical is also enabling us to expand into global adult recreational as evidenced by our recent entry into the Dutch recreational market through an investment in Growery B.V., which based on today’s global regulatory framework we expect to become the largest regulated recreational market outside of Canada,” he concluded.
First Quarter 2022 Highlights
(Unless otherwise stated, comparisons are made between fiscal Q1 2022, Q4 2021, and Q1 2021 results and are in Canadian dollars)
Medical Cannabis:
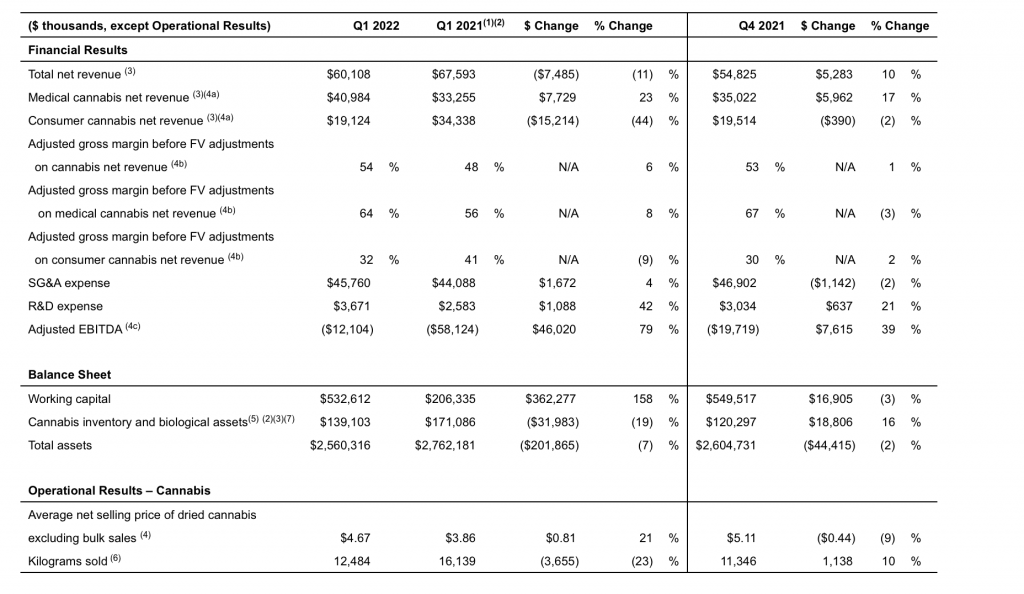
- Medical cannabis net revenue1 was $41.0 million, a 23% increase from the prior year period. The increase was primarily attributable to continued growth in the international medical business, 84% growth sequentially and 146% over the prior year comparative period, as the Company continued to develop new, high margin medical markets such as Israel.
- Adjusted gross margin before fair value adjustments on medical cannabis net revenue1 was 64% compared to 67% sequentially and 56% in the prior year period. The year over year improvement was a result of overall reduction in production costs due to the closure of non-core facilities as part of our business transformation plan and higher sales coming from our international sales, which yield higher margins.
Consumer Cannabis:
- Consumer cannabis net revenue1 was $19.1 million, relatively steady compared to the prior quarter net revenue of $19.5 million and a 44% decrease from the prior year period. Brand mix improved sequentially as part of the Company’s premiumization strategy with San Rafael ’71 and Whistler comprising 37% of the flower sales, compared to 29% in the prior quarter. The decrease from the prior year was due primarily to reduced orders from the provinces in Canada, which reflects the impacts of COVID-19 and began impacting our revenues in Q3 2021.
- Adjusted gross margin before fair value adjustments on consumer cannabis net revenue1 was 32% versus 30% sequentially and 41% in the prior year period. The sequential improvement was due to the improved mix of premium flower categories, and the change from the prior year was primarily driven by an increase in per-unit cost of sales due to under-utilized capacity at our core facilities as a result of scaling back production.
Consolidated:
- Adjusted gross margin before fair value adjustments on cannabis net revenue1 was 54% in Q1 2022 versus 53% in the prior quarter and 48% in Q1 2021. The increase in Adjusted gross margin compared to the prior quarter is due primarily to a shift in sales mix towards the premium flower categories in the adult consumer market and increased sales in our medical markets which command significantly higher average net selling prices and margins.
- Adjusted EBITDA1 loss improved to $12.1 million in Q1 2022 versus $19.7 million in Q4 2021 and $58.1 million in the prior year period. Excluding restructuring and contract termination charges, Adjusted EBITDA1 loss was $11.5 million(Q4 2021 – $15.5 million, Q1 2021 – $10.7 million) . The decrease in loss as compared to Q4 2021 was primarily driven by the 10% increase in revenues while Adjusted gross margins remained steady.
- Q1 2022 total cannabis net revenue1 was $60.1 million, up 10% sequentially. Reflecting the shift in mix toward our medical businesses, the Q1 2022 average net selling price per gram of dried cannabis1 increased to $4.67 per gram from $3.86 in Q1 2021 and down from $5.11 in Q4 2021 due to country mix in international sales. This excludes the impact of bulk wholesale of excess mid-potency cannabis flower at clear-out pricing.
Selling, General and Administrative (“SG&A”):
- SG&A, including Research and Development (“R&D”), was $44.0 million, excluding $5.4 million in restructuring, severance and prior year bonus accruals, versus $42.6 million in the prior year quarter.
| __________________________ |
| 1 These terms are non-GAAP measures, see “Non-GAAP Measures” below. |
Operational Efficiency Plan, Balance Sheet Strength, & Working Capital Improvement
Aurora has identified cash savings of $60 million to $80 million. We have already executed over $33 million in annualized run-rate cost savings to date, and expect to deliver the remainder before the end of Q2 fiscal 2023.
Approximately 60% of the savings are expected to be removed from our network through asset consolidation, and operational and supply chain efficiencies. The remaining 40% of savings are intended to be sourced through SG&A.
These cash savings will be reflected in our P&L either as they occur for SG&A savings, or as inventory is drawn down for production-related savings. These efficiencies are incremental to the approximately $300 million of total cost reductions achieved since the announcement of the Company’s business transformation plan in February 2020.
The Company also views a strong balance sheet as critical to operating the business, executing its strategic plans, and pursuing growth opportunities in a prudent, disciplined manner, including within the U.S. At September 30, 2021 Aurora has a cash balance of approximately $424.3 million, comprised of $372.8 million of cash and cash equivalents and $51.5 million in restricted cash, no secured term debt, and access to US$1 billion of capital under its shelf prospectus.
The Company’s focus on realizing operational efficiencies and management of cash has greatly improved operating cash flow; reducing the need for incremental capital. In Q1 2022, Aurora managed cash flow tightly using $18.1 million in cash to fund operations, including working capital investments and restructuring and severance payments of $0.6 million. Cash inflow from capital expenditures, net of disposals, in Q1 2022 was $3.1 million versus cash outflow of $15.3 million in Q1 2021 and $6.2 million of cash inflow in Q4 2021.
Cash used in operations and for capital expenditures are crucial metrics in Aurora’s drive toward generating sustainable positive free cash flow, and both have improved significantly over the past year. The Company’s ongoing business transformation, with the additional cost efficiency savings described earlier, is expected to move the operating cash flow metric in a positive direction over the coming quarters.
Net working capital generated a cash outflow of $3.4 million in the quarter, excluding the impacts of inventory impairment primarily driven by a decrease in accounts receivable.
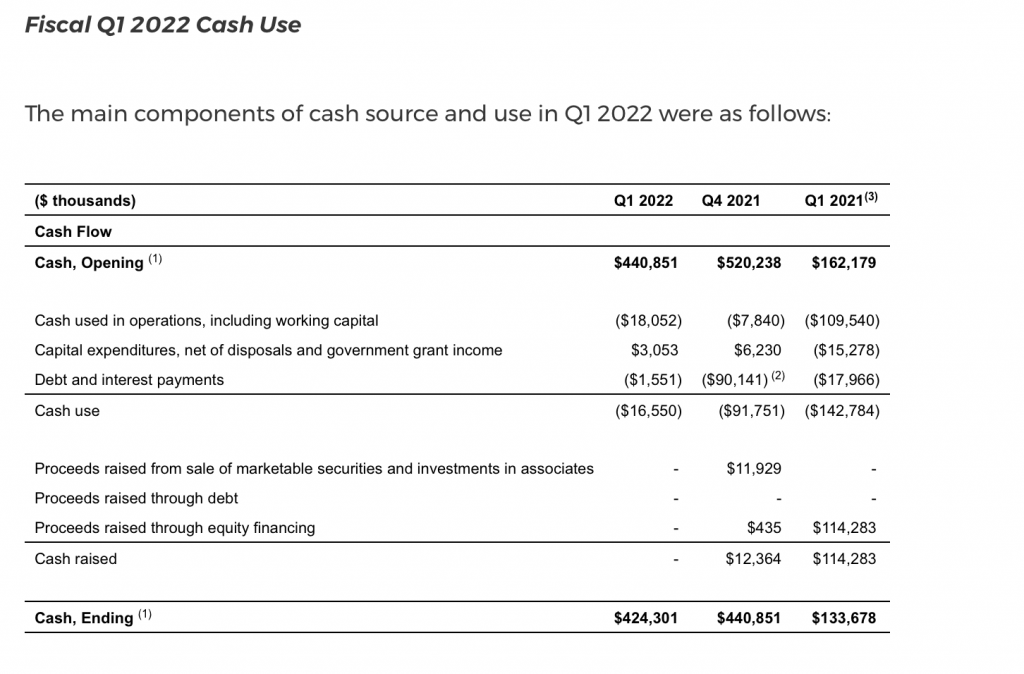
(1) | Includes restricted cash of $51.5M at Q1 2022, $19.4M at Q4 2021, and nil at Q1 2021. |
| (2) | Includes $88.7 million full principal repayment on the BMO Credit Facility. As of June 30, 2021, the BMO Credit Facility has been fully settled and discharged. |
| (3) | Previously reported amounts have been retroactively recast for the biological assets and inventory non-material prior period error. Refer to the “Significant Accounting Policies and Judgments” section in Note 2(d) of the Financial Statements. |
Refer to the “Consolidated Statement of Cash Flows” in the “Consolidated Financial Statements” for our cash flow statements prepared in accordance with IAS 7 – Statement of Cash Flows.
| (1) | Amounts have been retroactively recast for the biological assets and inventory non-material prior period error. Refer to the “Significant Accounting Policies and Judgments” Note 2(d) in the Financial Statements for further detail. | |
| (2) | As a result of the Company’s dissolution and divestment of its wholly-owned subsidiaries, Hempco and AHE, during the year ended June 30, 2021, the operations of Hempco and AHE have been presented as discontinued operations and the Company’s operational results have been retroactively restated, as required. Refer to Note 12(b) of the Financial Statements for additional information. | |
| (3) | Includes the impact of actual and expected product returns and price adjustments (Q1 2022 – $0.7 million; Q4 2021 – $0.7 million; Q1 2020 – $0.8 million). | |
| (4) | These terms are defined in the “Cautionary Statement Regarding Certain Non-GAAP Performance Measures” section of the MD&A. Refer to the following sections for reconciliation of non-GAAP measures to the IFRS equivalent measure: | |
| a. | Refer to the “Revenue” section for a reconciliation of cannabis net revenue to the IFRS equivalent. | |
| b. | Refer to the “Cost of Sales and Gross Margin” section for reconciliation to the IFRS equivalent. | |
| c. | Refer to the “Adjusted EBITDA” section for reconciliation to the IFRS equivalent. | |
| (5) | Represents total biological assets and cannabis inventory, exclusive of merchandise, accessories, supplies and consumables. | |
| (6) | The kilograms sold is offset by the grams returned during the period. |
Conference Call
Aurora will host a conference call today,Tuesday, November 9, 2021, to discuss these results. Miguel Martin, Chief Executive Officer, and Glen Ibbott, Chief Financial Officer, will host the call starting at 5:00 p.m. Eastern Time | 3:00 p.m. Mountain Time. A question and answer session will follow management’s presentation.
Conference Call Details
| DATE: | Tuesday, November 9, 2021 | |
| TIME: | 5:00 p.m. Eastern Time | 3:00 p.m. Mountain Time | |
| WEBCAST: | Click here |
Investors may submit questions in advance or during the conference call itself through same weblink listed above. This weblink has also been posted to the Company’s “Investor Info” link at https://investor.auroramj.com/ under “News & Events”.

