
Village Farms International, Inc. (“Village Farms” or the “Company”) (NASDAQ: VFF) (TSX: VFF) today announced its financial results for the three months and year ended December 31, 2020. All figures are in U.S. dollars unless otherwise indicated.
The Company’s financial statements for the three months and year ended December 31, 2020, as well as the comparative periods for 2019, have been prepared and presented under United States Generally Accepted Accounting Principals (“GAAP”). On December 31, 2020, Village Farms owned 100% of Pure Sunfarms Corp. (“Pure Sunfarms”), as the full acquisition of the remaining interest in Pure Sunfarms occurred November 2, 2020. Accordingly, for the 60-day period from November 2 to December 31, 2020, Pure Sunfarms’ financial results are consolidated with Village Farms results for both the fourth quarter and year ended December 31, 2020. For the October 1 to November 1 and January 1 to November 1, 2020 portions of the three-month and 12-month periods ending December 31, 2020, Pure Sunfarms is accounted for on a proportionate basis as “Equity Earnings from Unconsolidated Entities”.
Pure Sunfarms’ Fourth Quarter and Other Recent Highlights
(Dollar Amounts are Before Village Farms’ Proportionate Share)
- Achieved 28% sequential quarterly growth and 248% year-over-year growth in retail branded sales to provincial distributors to $15.5 million, following sequential quarterly growth of 40% from the second to the third quarter of 2020;
- Achieved its eighth consecutive quarter of net income (before the $3.3 million non-cash impact resulting from the write-up of inventory required under GAAP with the acquisition of the remaining interest in Pure Sunfarms on November 2, 2020) and its ninth consecutive quarter of positive Adjusted EBITDA;
- Was the top selling brand of dried flower products with the OCS (by kilograms sold and dollars sold) for both the quarter and year ended December 31, 2020, and remained the top-selling brand of dried flower products with the OCS (by kilograms sold and dollars sold) since launch in October 2019;
- Continued to roll out its first Cannabis 2.0 products, specifically Full Spectrum Vapes in 510 thread cartridges and first bottled oil products, in September 2020, and subsequent to quarter end, launched its first cannabis-infused edible products, Pure Sunfarms cannabis-infused gummies;
- Entered into a supply agreement with Medical Cannabis by Shoppers Inc. under which Pure Sunfarms will supply a range of its products to be made available to Medical Cannabis by Shoppers™; and
- On March 15, 2021, extended and amended its credit agreement with Bank of Montreal, which had a maturity date of February 2022, to February 2024.
| *Data cited has been calculated by Pure Sunfarms from sales information provided by OCS. |
Village Farms’ Consolidated Financial Summary for the Three Months Ended and Year Ended December 31, 2020 and December 31, 2019 and Corporate Highlights
| 1. | Sales, Net Income, Income (Loss) per share and Adjusted EBITDA includes results from Pure Sunfarms pursuant to the Company’s statutory reporting requirements. |
| 2. | Adjusted EBITDA is not a recognized earnings measure and does not have a standard meaning prescribed by GAAP. See “Non-GAAP Measures” below. |
- Acquired all issued and outstanding shares of Pure Sunfarms, as a result of which, as of November 2, 2020, the Company owned 100% of Pure Sunfarms;
- Wholly owned subsidiary, Village Farms Clean Energy, Inc. (“VFCE”), renewed and extended its existing contract with the City of Vancouver under which VFCE receives landfill gas captured by the City of Vancouver at the City’s landfill site in Delta, BC, enabling the transition of VFCE to a more attractive long-term business model based on the conversion of landfill gas to high-demand Renewable Natural Gas;
- Subsequent to quarter end, completed a registered direct offering with certain institutional investors for the purchase and sale of an aggregate of 10,887,097 common shares at a purchase price of US$12.40(approximately C$15.70) per unit for gross proceeds of approximately US$135 million (approximately C$171 million);
- Subsequent to quarter end, received warrant exercise proceeds of US$10.3 million resulting in the issuance of 1,773,585 additional common shares. The warrants were issued as part of the September 2020Registered Direct equity offering. As of the date of this news release, 2,924,528 warrants remain outstanding;
- Subsequent to quarter end, repaid in full the C$19.9 million (approximately US$15.6 million) promissory note, plus accrued interest of C$621,534.25 (approximately US$486,849.78), that the Company issued to Emerald Health Therapeutics, Inc. as partial consideration for the November 2020 acquisition of the remaining common shares of Pure Sunfarms that the Company did not own; and,
- Subsequent to quarter end, announced that the Company will be added to the S&P/TSX Composite Index (Consumer Staples sector) prior to trading on March 22, 2021.
Pure Sunfarms’ Financial Summary for the Three Months Ended and Year Ended December 31, 2020 and December 31, 2019Fef (Before Village Farms’ Proportionate Share)
Management Commentary
“The fourth quarter was a solid finish to a year of significant achievement for Village Farms and our wholly owned Canadian cannabis subsidiary, Pure Sunfarms, which saw great success as it transitioned its focus to retail branded sales from nearly all sales in 2019 being non-branded, mainly to other producers,” said Michael DeGiglio, CEO, Village Farms. “Following a 40% sequential increase from the second to the third quarter of 2020, Pure Sunfarms sales of branded retail products to provincial distributors increased another 28% sequentially from the third to the fourth quarter, as our branded dried flower products continued to be the top seller with the Ontario Cannabis Store, and our first Cannabis 2.0 products were well received by consumers. This contributed to our ninth consecutive quarter of profitability, even as we invested during the quarter to support our future growth.”
“2020 was a year that saw Pure Sunfarms prove out its cultivation excellence and its differentiated product strategy, becoming a leading brand and consistently delivering profitability – all of which was accomplished amidst the challenges of the pandemic. We are building on this momentum in 2021 with plans to start cultivation in our Delta 2 greenhouse in the second half of the year to meet the strong and growing demand for Pure Sunfarms’ products, as we continue to enhance and expand our offerings to participate in, and help drive the growth of, the Canadian cannabis market. We look forward to continued growth in branded retail sales in 2021 and we are opportunistic with respect to sales to other producers as many of them look to Pure Sunfarms as an economic source of consistent, high quality flower.”
“The best-in-class operations, strong market share performance and consistent profitability of our Canadian cannabis business, supported by a significantly strengthened balance sheet, gives us great confidence in our ability to capitalize on the U.S. cannabis opportunity. We are encouraged by the evolution of the regulatory environment in the U.S. and have developed multiple strategies to enable Village Farms to legally participate in this market, leveraging our deep experience and organizational strength, supported by one of the largest greenhouse footprints in the country.”
“We also expect to meaningfully advance our international cannabis strategy in 2021, building on our first investments last year, pursuing select emerging markets with significant long-term potential through capital efficient investments. All of this positions Village Farms to deliver sustainable shareholder value over the short-, medium- and long-terms.”
“Finally, alongside the momentum at Pure Sunfarms, our produce business had a strong 2020, driven by higher pricing amidst elevated demand across our national and regional grocer and “big box” customers for much of the year. Our significant progress over the last two years in transitioning capacity designated for cannabis to growing partners enabled us to take full advantage of these market dynamics, coupled with year on year improvements at our Texas green house facilities, drove a $16.5 million year over-year improvement in Adjusted EBITDA to support our longer-term growth opportunities in cannabis.”
COVID-19 Update
All Village Farms’ production facilities in Texas, British Columbia, and Pure Sunfarms’ facilities in Canada remain open and operational. The Company has experienced a small number of COVID-19 illnesses at its facilities, however, the Company’s protocols were followed and there has been no material disruption to operations. Village Farms and Pure Sunfarms adhere to the highest health and safety standards in their operations and each has put in place heightened hygiene practices and safety protocols, including more stringent cleaning and sanitization, and are taking appropriate precautions throughout all operations as per the recommendations of health authorities. The Company will continue to enhance and evolve such practices and protocols as the situation warrants.
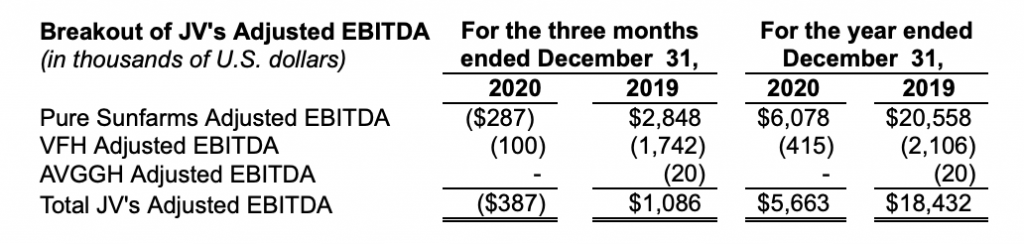
| 7. | Adjusted EBITDA is not a recognized earnings measure and does not have a standard meaning prescribed in by GAAP. Therefore, Adjusted EBITDA may not be comparable to similar measures presented by other issuers. See “Non-GAAP Measures” for a definition and reconciliation of Adjusted EBITDA to net income (loss), the nearest comparable measurement under GAAP. Management believes that Adjusted EBITDA is a useful supplemental measure in evaluating the performance of the Company. Adjusted EBITDA includes the Company’s majority non-controlling interest in Pure Sunfarms (through November 1, 2020), 65% interest in VFH and 60% interest in AVGGH |
Discussion of Financial Results
A discussion of our consolidated results for the years ended December 31, 2020 and 2019 is included below. The consolidated results include all three of our operating segments, produce, cannabis and energy, along with all public company expenses. Pure Sunfarms was acquired in its entirety on November 2, 2020; from November 2, 2020 through December 31, 2020, the operating results of Pure Sunfarms are consolidated in our Consolidated Statements of Income (Loss), and for the year ended December 31, 2019 and the period January 1, 2020 to November 1, 2020, Pure Sunfarms’ results are included in equity earnings of consolidated entities in our Consolidated Statements of Income (Loss).
We also present a discussion of the full year operating results of Pure Sunfarms, before any allocation to Village Farms, which were not consolidated in our financial results for the period of January 1, 2020 to November 1, 2020 and consolidated in our results for the period November 2, 2020 to December 31, 2020. As a result of the Pure Sunfarms acquisition, Village Farms recognized a gain on acquisition of $23,631 as it adjusted the assets and liabilities of Pure Sunfarms to the acquisition date fair value, which was above the carrying value of the Company’s investment in Pure Sunfarms. One of the adjustments resulted in an increase in the fair value of its flower inventory on-hand on the acquisition date. A portion of this inventory was sold in the fourth quarter of 2020, which resulted in this inventory being sold, effectively with no gross margin, as cost of sales was increased by $3,295 for this flower sold in the fourth quarter of 2020 as a result of evaluation of its flower inventory to fair value. This is a non-cash accounting charge to cost of sales and should be adjusted for when analyzing the actual operational results of Pure Sunfarms.
Consolidated Village Farms (in US$)
Three months ended December 31, 2020 compared to the three months ended December 31, 2019.
Sales
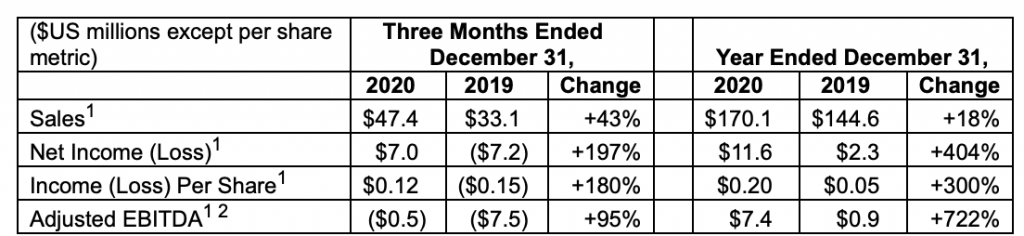
Sales for the three months ended December 31, 2020 increased $14,308, or 43%, to $47,364 compared to $33,056 for the three months ended December 31, 2019. Due to the acquisition of Pure Sunfarms on November 2, 2020, Village Farms began fully consolidating operating results of Pure Sunfarms. The increase in sales was primarily due to inclusion of Pure Sunfarms November and December sales of $12,778. Produce sales also increased $1,479 primarily due to an increase in pricing for tomatoes between the two comparable periods.
Cost of Sales
Cost of sales for the three months ended December 31, 2020 increased $8,822, or 24%, to $46,317 in comparison to $37,495 for the three months ended December 31, 2019, due primarily to two months of Pure Sunfarms cost of sales of $10,585, partially offset by a decrease in our produce cost of sales of $1,998. The Pure Sunfarms cost of sales of $10,585 includes a non-cash accounting charge of $3,295, as a result of adjusting flower inventory to fair value at the acquisition date. Produce cost of sales decreased primarily due to the transition of the Delta 2 facility, from tomato production in 2019 to Pure Sunfarms in 2020 for future cannabis production.
Gross Margin
Gross margin for the three months ended December 31, 2020 increased $5,486, or 124%, to $1,047 compared to ($4,439) for the three months ended December 31, 2019. Gross margin for 2020 was negatively impacted by the non-cash accounting charge of $3,295 for Pure Sunfarms, as a result of adjusting flower inventory to fair value at the acquisition date. The positive gross margin change year-over-year was driven by two months of Pure Sunfarms gross margin of $2,193 and an improvement in the produce segment for both our own production and our third-party suppliers, primarily from higher selling prices of tomatoes and higher volume from our third-party suppliers.
Selling, General and Administrative Expenses
Selling, general and administrative expenses for the three months ended December 31, 2020 increased $1,547, or 32%, to $6,410 in comparison to $4,863 for the three months ended December 31, 2019. The increase was primarily due to the inclusion of two months of Pure Sunfarms expenses and an increase in public company costs such as investor relations, legal and regulatory, listing fees and incremental costs of U.S. GAAP and U.S. reporting compliance, partially offset by reductions for company-wide travel-related expenses due to COVID-19.
Net Income (Loss)
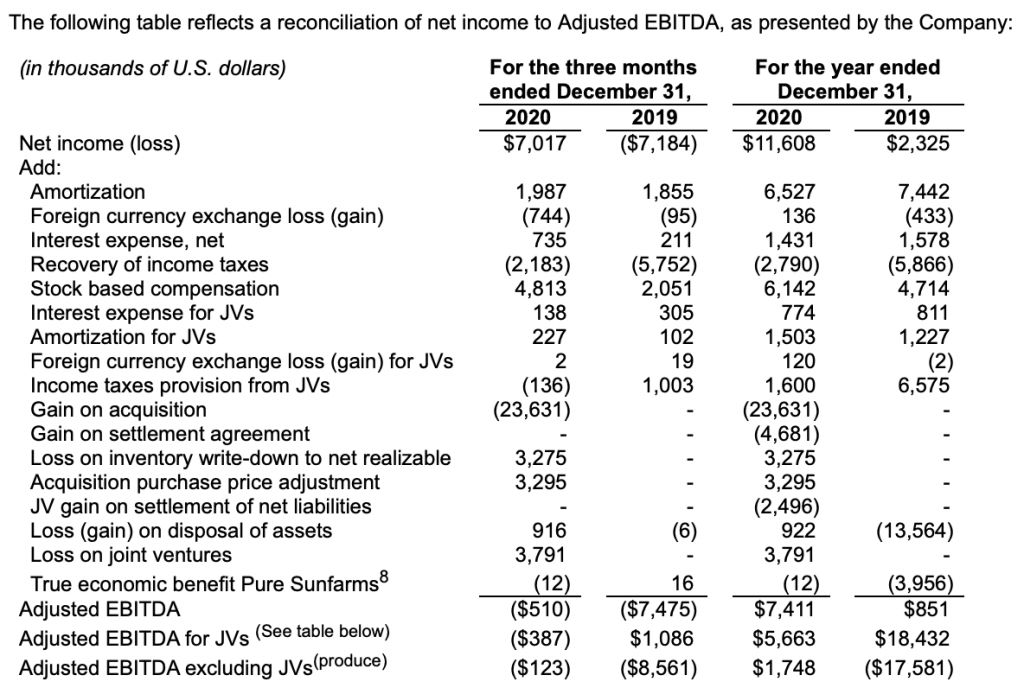
Net income for the three months ended December 31, 2020 was $7,017 in comparison to ($7,184) for the three months ended December 31, 2019. Net income was driven by a significant improvement in gross profit of $5,486 between the comparable periods and the gain on acquisition of $23,631 due to acquiring the remaining shares of Pure Sunfarms on November 2, 2020. The positive impacts to net income were partially offset by the ($3,791) write-down of the loan to VF Hemp and increases year-over-year in stock compensation and selling, general and administrative expenses.
Adjusted EBITDA
Adjusted EBITDA for the three months ended December 31, 2020 increased $6,965 to ($510) compared to ($7,475) for the three months ended December 31, 2019, primarily as a result of improved gross margin of the produce segment and inclusion of the operating results of Pure Sunfarms for November 2 through December 31, 2020. See the reconciliation of Adjusted EBITDA to net income in “Non-GAAP Measures—Reconciliation of Net Earnings to Adjusted EBITDA”.
Consolidated Village Farms (in US$)
Year ended December 31, 2020 compared to the year ended December 31, 2019.
Sales
Sales for the year ended December 31, 2020 increased $25,518, or 18%, to $170,086 compared to $144,568 for the year ended December 31, 2019. The increase in sales was primarily due to an increase in supply partner revenues of $14,748, Pure Sunfarms November and December sales of $12,778, partially offset by a decrease in VFCE power sales of ($735) and our own production revenues of ($1,273). The supply partner revenue increase was due to higher volumes. The decrease in our own production revenues was due primarily to the closure of the Delta 2 facility, which was optioned to Pure Sunfarms in order to expand its potential cannabis production capacity as needed.
Cost of Sales
Cost of sales for the year ended December 31, 2020 increased $7,213, or 5%, to $159,126 compared to $151,913 for the year ended December 31, 2019, due primarily to an increase in supply partner costs of $13,128, two months of Pure Sunfarms cost of sales of $10,585, partially offset by a decrease in our own production costs of ($15,940) and lower clean energy costs of ($560). The Pure Sunfarms cost of sales of $10,585 includes a non-cash accounting charge of $3,295, as a result of adjusting flower inventory to fair value at the acquisition date.
The increase in year over year supply partner produce costs was due to higher volumes of tomatoes, peppers and cucumbers which also drove higher freight costs. The reduction in our own production costs were driven by the transition of the Delta 2 facility to Pure Sunfarms, along with lower costs at our Texas facilities, primarily driven by lower pounds sold and a decrease in the cost per pound produced.
Gross Margin
Gross margin for the year ended December 31, 2020 increased $18,305 to $10,960 in comparison to ($7,345) for the year ended December 31, 2019. Gross margin for 2020 was negatively impacted by the non-cash accounting charge of $3,295 related to adjusting the flower inventory to fair value at the acquisition date. The positive gross margin was driven by an improvement in the produce segment for both our own production and our third-party suppliers, primarily from higher selling prices of tomatoes and higher volume from our third-party suppliers.
Selling, General and Administrative Expenses
Selling, general and administrative expenses for the year ended December 31, 2020 increased $2,324, or 14%, to $19,086 compared to $16,762 for the year period ended December 31, 2019. The increase was primarily due to the inclusion of two months of Pure Sunfarms expenses and an increase in public company costs such as investor relations, legal and regulatory, listing fees and incremental costs of U.S. reporting compliance, partially offset by reductions for company-wide travel-related expenses due to COVID-19.
Net Income (Loss)
Net income for the year ended December 31, 2020 was $11,608 in comparison to $2,325 for the year ended December 31, 2019. Net income was driven by a significant improvement in gross profit of $10,960 for the year ended December 31, 2020 as compared to ($7,345) for the year ended December 31, 2019. The gross profit was primarily due to an increase from Pure Sunfarms due to the acquisition on November 2, 2020 and higher supply partner gross profit. Net income was also significantly affected by the 2020 gain in acquisition of Pure Sunfarms of $23,631 and the 2020 gain on the Settlement Agreement of $4,681, partially offset by the ($5,163)2020 write-down of hemp biomass to net realizable value, the 2020 Pure Sunfarms inventory purchase price non-cash accounting charge of ($3,295), and the 2020 write-off of ($3,791) of the Company’s loan to VF Hemp. The Company’s 2019 net income was affected by the gain on the contribution of the Delta 3 greenhouse to Pure Sunfarms of $13,564.
Adjusted EBITDA
Adjusted EBITDA for the year ended December 31, 2020 increased $6,560 to $7,411 in comparison to $851 for the year ended December 31, 2019, primarily as a result of improved gross margin of the produce segment and inclusion of the operating results of Pure Sunfarms for November 2 through December 31, 2020. See the reconciliation of Adjusted EBITDA to net income in “Non-GAAP Measures—Reconciliation of Net Earnings to Adjusted EBITDA”.
Pure Sunfarms (in C$)
Pure Sunfarms’ comparative analysis are based on the consolidated results of Pure Sunfarms Corp. for the years ended December 31, 2020 and December 31, 2019 and the three months ended December 31, 2020, September 30, 2020 and December 31, 2019, not accounting for the percentage owned by Village Farms. Please see the Reconciliation of U.S. GAAP Results to Proportionate Results for a presentation of Pure Sunfarms’ proportionate results for the years ended December 31, 2020 and December 31, 2019.
Three months ended December 31, 2020 compared to the three months ended September 30, 2020.
Sales
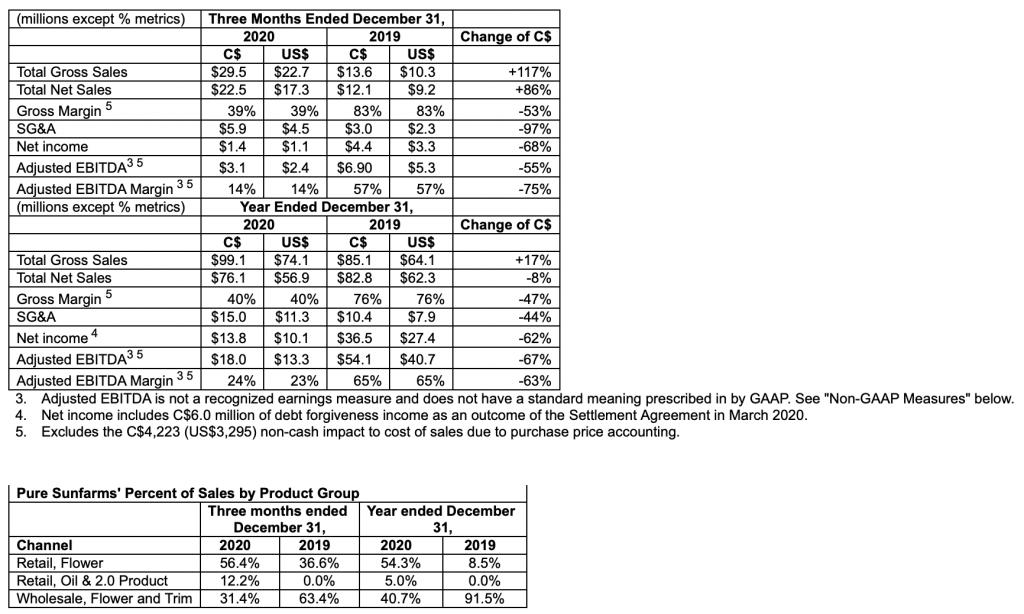
Sales for three months ended December 31, 2020 of C$22,527 were flat as compared to C$22,627, or a (0.4%) decrease from the three months ended September 30, 2020. The change was driven by a 28% increase in provincial retail (branded) sales and offset by a 33% decrease in wholesale (non-branded) sales. The quarterly growth in retail sales was directly attributable to a 52% increase in Pure Sunfarms retail large format sales, a 30% increase in pre-rolls and a 179% increase in Pure Sunfarms oil and cannabis 2.0 products.
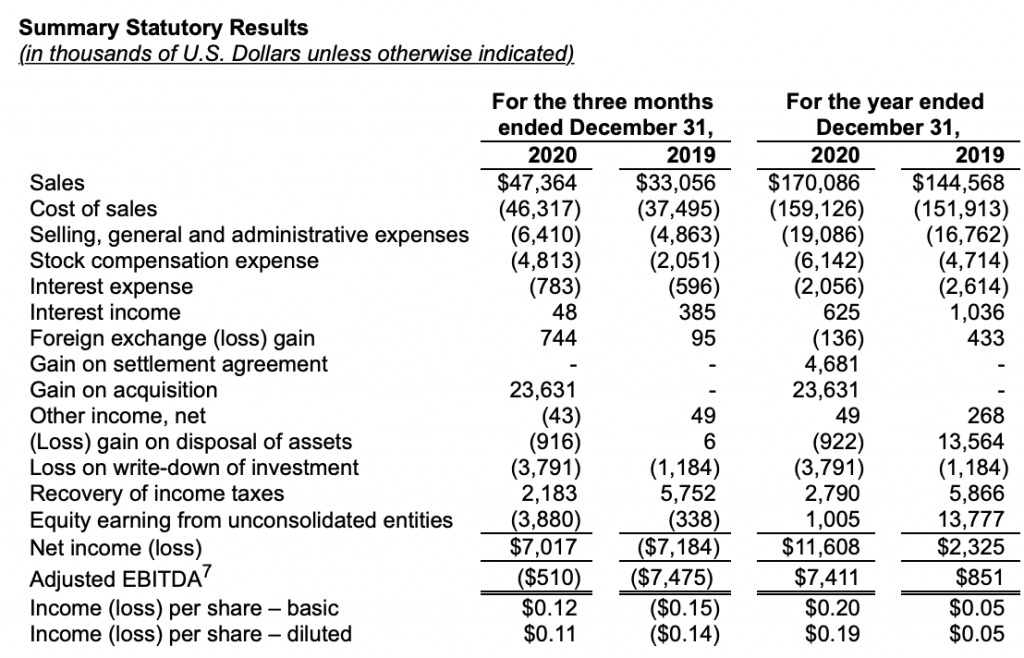
The channel makeup of the fourth quarter sales was 69% to the retail channel and 31% to the wholesale channel. The channel makeup of the third quarter sales was 54% to the retail channel and 47% to the wholesale channel. Cannabis oil and 2.0 derivative products were 12.3% of fourth quarter sales, which are included in the retail channel.
Cost of Sales
Cost of sales for the three months ended December 31, 2020 and three months ended September 30, 2020 was C$13,728 (excluding the purchase price flower inventory adjustment of C$4,223) and C$14,826, respectively, a decrease of (6%). Cost of sales for the three months ended December 31, 2020 and September 30, 2020 was C$17,951 (with the purchase price for flower inventory) and C$14,826, respectively, an increase of 21%. The decrease in costs was primarily due to a 37% increase in branded large format kilograms sold which has lower overhead and labor cost compared to retail small format products, while the third quarter also includes a write-down to net realizable value of oil distillate inventory of C$1,412 in September 2020.
Gross Margin
Gross margin for the three months ended December 31, 2020 and three months ended September 30, 2020 was C$8,798 or 39% (excluding the purchase price flower inventory adjustment of C$4,223) and C$7,801 or 34%, respectively. The quarter-on-quarter improvement was primarily due to the decrease in cost of sales.
Selling, General and Administrative Expenses
Selling, general and administrative expenses for the three months ended December 31, 2020 and September 30, 2020 were C$5,924 and C$3,261, respectively, an increase of 82%. The increase was primarily due to incremental year over year expenses for sales support, marketing, additional headcount and implementation of a new ERP system as well as bad debt expense.
Net Income
Net income (with the acquisition charge for inventory) for the three months ended December 31, 2020 was C$1,379 versus C$2,779 for the three months ended September 30, 2020. The increase of C$1,400 was primarily due to the elimination of biological asset accounting treatment post acquisition and an increase in selling, general and administrative expenses between comparable periods.
Adjusted EBITDA
Adjusted EBITDA for the three months ended December 31, 2020 decreased (45%) to C$3,083 (excluding the purchase price flower inventory adjustment of C$4,223) from C$5,642 for the three months ended September 30, 2020. The decrease was primarily driven by the increase in selling, general and administrative expenses which offset the increase in gross margin. See the reconciliation of Adjusted EBITDA to net income in “Non-GAAP Measures” below.
Pure Sunfarms (in C$)
Three months ended December 31, 2020 compared to the three months ended December 31, 2019.
Sales
Sales for the three months ended December 31, 2020 and 2019 was C$22,527 and C$12,142, respectively, an increase of 86%. The change was due to 248% increase in provincial retail (branded) and (8%) decrease in wholesale (non-branded) sales for the three months ended December 31, 2020 compared to the three months ended December 31, 2019. The net average selling price of retail flower for the three months ended December 31, 2020 was lower than the net average selling price for the three months ended December 31, 2019 by (37%). Pure Sunfarms sales for the quarter ended December 31, 2019 included C$8,100 of revenue recognized upon the settlement of the 2019 supply agreement with Emerald.
Cost of Sales
Cost of sales for the three months ended December 31, 2020 and 2019 was C$13,728 (excluding the purchase price flower inventory adjustment of C$4,223) and C$2,115, respectively, an increase of 549%. Cost of sales for the three months ended December 31, 2020 and 2019 was C$17,951 (with the purchase price for flower inventory) and C$2,115, respectively, an increase of 749%. The increase in costs excluding the distillate inventory write down was 494%, primarily due to a 371% increase in branded kilograms sold as well as the oil and cannabis 2.0 products launched in 2020. These products require incremental packaging, overhead and logistics expenses compared to product sold through the wholesale channel.
Gross Margin
Gross margin for the three months ended December 31, 2020 and 2019 was C$8,798 (excluding the purchase price flower inventory adjustment of C$4,223) and C$10,027, or 39% and 83% as a percentage of net sales, respectively. The decline was due to a lower price environment for both retail and wholesale channels in 2020 as compared to the fourth quarter of 2019, as well as an increase in costs as a result of Pure Sunfarms’ increase in provincial retail (branded) sales in 2020, as the majority of sales in the fourth quarter of 2019 were related to the settlement of the 2019 Emerald supply agreement which had no cost of sales, excluding this revenue, the 2019 fourth quarter gross margin for Pure Sunfarms would have been 48%.
Selling, General and Administrative Expenses
Selling, general and administrative expenses for the three months ended December 31, 2020 and 2019 were C$5,924 and C$2,990, respectively, an increase of 98%. The increase was primarily due to incremental year over year expenses for sales support, marketing, additional headcount and implementation of a new ERP system as well as bad debt expense.
Net Income
Net income (with the acquisition charge for inventory) for the three months ended December 31, 2020 and 2019 was C$1,379 and C$4,354 respectively, a decrease of (68%). The decrease was primarily due to the decrease in gross margin and the increase in selling, general and administrative expenses between comparable periods.
Adjusted EBITDA
Adjusted EBITDA for the three months ended December 31, 2020 declined (56%) to C$3,083 (excluding the purchase price flower inventory adjustment of C$4,223) from C$6,945 for the same prior year period. The decrease was primarily due to the decrease in gross margin. See the reconciliation of Adjusted EBITDA to net income in “Non-GAAP Measures” below.
Pure Sunfarms (in C$)
Year ended December 31, 2020 compared to the year ended December 31, 2019.
Sales
Pure Sunfarms’ net sales for the years ended December 31, 2020 and 2019 was C$76,060 and C$82,810, respectively, a decrease of (8%). Net sales for 2019 included $8,100 of revenue recognized on the settlement of the 2019 Emerald supply agreement, excluding this revenue, from 2019, would result in a small year on year increase in net sales of 2%. The year over year change is comprised of a significant increase in sales to provincial boards (branded sales) which began in September 2019 offset by a decrease in the wholesale channel (non-branded) which had been the company’s sole source of revenue until September 2019.
For the year ended December 31, 2020, 54% of revenue was generated from branded flower and pre-roll sales, with an additional 5% from branded cannabis oil and vape pens, which Pure Sunfarms launched in September 2020. Non-branded sales accounted for 41% of revenue in 2020 as compared to 92% in 2019, as Pure Sunfarms moved from a predominantly wholesale market supplier in 2019 to a mixed wholesale and retail market supplier in 2020, primarily as a result of receiving its retail sales license in September 2019.
The net average selling price of branded flower and pre-roll formats in 2020 was lower than 2019 by approximately (38%). This reduction in sales price was primarily due to the launch and growth of large format sales of C$16,970, which Pure Sunfarms began selling in 2020. The net average selling price of bulk non-branded flower decreased by (65%) as supply levels in the wholesale channels outpaced the growth of demand.
Cost of Sales
Cost of sales for the years ended December 31, 2020 and 2019 was C$45,755 (excluding the purchase price flower inventory adjustment of C$4,223) and C$20,021, respectively, an increase of 129%. The increase was primarily driven by an 866% volume increase of branded flower and pre-roll sales, which has an incremental cost of production to manufacture over bulk product sold in the wholesale channel. During 2020, the company’s cost of sales also includes a C$1,412 inventory write down for distillate oil purchased from third party extraction companies for which the market value has dropped since the initial purchase.
Gross Margin
Gross margin for the year ended December 31, 2020 decreased (C$32,484) (excluding the purchase price flower inventory adjustment of C$4,223), or (52%), to C$30,305 from C$62,789 for the year ended December 31, 2019. Gross margin for 2020 was impacted by the reduction in average selling price of flower in 2020, supply exceeding demand in the wholesale channels and the C$1,412 inventory write-down for distillate oil for which the net realizable value decreased from the initial purchase. The 2019 gross margin benefited from the $8,100 revenue recognized in the settlement of the 2019 Emerald supply agreement.
Selling, General and Administrative Expenses
Selling, general and administrative expenses for the years ended December 31, 2020 and 2019 was C$15,014 and C$10,445, respectively, an increase of 44%. The increase was primarily due to higher marketing costs, additional headcount, implementation of a new ERP system and a bad debt charge.
Net Income
Net income (with the acquisition charge for inventory) for the years ended December 30, 2020 and 2019 was C$13,789 and C$36,456, respectively, a decrease of (62%). The decrease was primarily due to the decrease in gross margin for the comparable years.
Adjusted EBITDA
Adjusted EBITDA (excluding the purchase price inventory adjustment of C$4,223) was C$17,960 for the year ended December 31, 2020, a decrease of (67%) from C$54,073 for the year ended December 31, 2019. The decrease was primarily due to a lower gross margin from a reduced average selling price and increased costs of sales along with an increase in selling, general and administrative expenses for the year ended December 31, 2020 compared to the same prior year period.
Produce (in US$)
Year ended December 31, 2020 compared to the year ended December 31, 2019.
Sales
Produce sales for the year ended December 31, 2020 increased $12,469, or 9%, to $157,037 compared to $144,568 for the year ended December 31, 2019. The increase in sales was primarily due to an increase in supply partner revenues of $14,748, partially offset by a decrease in our own production revenues of ($1,276) and lower clean energy revenue of ($733). The supply partner revenue increase was due to higher volumes, with a 2% increase in tomato pounds sold, a 49% increase in pepper pounds sold, a 35% increase in cucumber pieces and an 83% increase in mini cucumber pounds. The decrease in our own production revenues was due primarily to the transition of the Delta 2 facility, which was optioned to Pure Sunfarms in order to expand its potential cannabis production capacity as needed. The decrease in production at our own facilities was partially offset by higher selling prices for tomatoes stemming from changes in consumer buying habits affected by COVID-19. The increase in net selling price in the commodity items was primarily the result of a supply shortage throughout most of 2020, due to an increase in grocery store traffic, driven by COVID-19 measures, as well as a global tomato virus that is negatively impacting tomato supplies.
Cost of Sales
Cost of sales for the year ended December 31, 2020 decreased ($3,373), or (2%), to $148,540 from $151,913 for the year ended December 31, 2019, due primarily to an increase in supply partner costs of $13,128, partially offset by a decrease in our own production costs of ($15,940) and lower clean energy costs of ($561). The increase in year over year supply partner costs was due to higher volumes of tomatoes, peppers and cucumbers which also drove higher freight costs. The reduction in our own production costs were driven by the transition of the Delta 2 facility to Pure Sunfarms, along with lower costs at our Texas facilities. The decrease in Texas production costs were due to the decrease in pounds sold and cost per pound. Our cost per pound costs, at our Texas produce greenhouses have been negatively impacted by the brown rugoses tomato viruses in both years causing large write-downs of inventory and lower tomato yields.
Adjusted EBITDA
Adjusted EBITDA for the year ended December 31, 2020 increased $16,586 to ($995) from ($17,581) for the year ended December 31, 2019 due primarily to an increase in gross margin in both our own production and supply partner for 2020 versus the comparative 2019 period. See the reconciliation of Adjusted EBITDA to net income in “Non-GAAP Measures” below.
Non-GAAP Measures
References in this news release to “Adjusted EBITDA” are to earnings (including the equity in earnings of the joint ventures) before interest, taxes, depreciation and amortization (“EBITDA”), as further adjusted to exclude foreign currency exchange gains and losses on translation of long-term debt, unrealized gains on the changes in the value of derivative instruments, stock compensation, and gains and losses on asset sales, and adjusts for the difference in accounting treatment of Pure Sunfarms, which we believe is necessary to reflect the true economic value of our interest in Pure Sunfarms. Adjusted EBITDA is a cash flow measure that is not recognized under GAAP and does not have a standardized meaning prescribed by GAAP. Therefore, Adjusted EBITDA may not be comparable to similar measures presented by other issuers. Although net income or loss is the most directly comparable financial measure calculated and presented in accordance with GAAP, investors are cautioned that Adjusted EBITDA should not be construed as an alternative to net income or loss determined in accordance with GAAP as an indicator of the Company’s performance or to cash flows from operating, investing and financing activities as measures of liquidity and cash flows. Management believes that Adjusted EBITDA is an important measure in evaluating the historical performance of the Company.
We also present Adjusted EBITDA, earnings per share and diluted earnings per share on a proportionate segment basis. Each of the components of Adjusted EBITDA, on a proportionate segment basis, are presented in the tables below that present a reconciliation of GAAP results to proportionate results. We believe that the ability of investors to assess our overall performance may be improved by the disclosure of proportionate segment Adjusted EBITDA, earnings per share and diluted earnings per share.
| 8. | The GAAP treatment of our equity earning of Pure Sunfarms is different than under International Financial Reporting Standards (“IFRS”). Under GAAP the Emerald shares held in escrow are not considered issued until paid for pursuant to the GAAP concept of ‘hypothetical liquidation’. As a result, our ownership percentage for the three months and year ended December 31, 2019 was 54.4% and 57.7%, respectively, compared to our economic interest under IFRS of 50% for the same periods. For the three months and year ended December 31, 2020, our ownership was 86.2% and 64.8%, respectively. |
Reconciliation of U.S. GAAP Results to Proportionate Results
The following tables are a reconciliation of the GAAP results to the proportionate results (which include our proportionate share of Pure Sunfarms and VFH and AVGGH (“Hemp”) operations). The tables reflect the full statements of income for Pure Sunfarms, VFH and AVGGH multiplied by the ownership percentage of the Company (versus presenting the results of these joint ventures in Equity in Earnings of Unconsolidated Entities):


