
Second Quarter Marks Fourth Consecutive Quarter of Sequential Growth in Retail Branded Sales at 22% and 11thConsecutive Quarter of Positive EBITDA for Pure Sunfarms –
— Pure Sunfarms Becomes Top-Selling Licensed Producer of Dried Flower in Ontario, Remains Top-Selling Dried Flower Brand in Ontario and is Top-Selling Dried Flower Brand in Alberta and British Columbia –
VANCOUVER, BC, Aug. 9, 2021 /PRNewswire/ – Village Farms International, Inc. (“Village Farms” or the “Company”) (NASDAQ: VFF) (TSX: VFF) today announced its financial results for the second quarter ended June 30, 2021. All figures are in U.S. dollars unless otherwise indicated. For Consolidated Results see below.
Management Commentary
“We are so proud to report another record quarter for Pure Sunfarms’ retail branded sales, which grew 22% sequentially – the fourth consecutive quarter of 20%-plus growth – which contributed to total net sales growth of 38% sequentially, once again outpacing the broader retail cannabis market as we continue to gain national market share,” said Michael DeGiglio, CEO, Village Farms. “Importantly, we are also reporting a 192% sequential increase in adjusted EBITDA for Pure Sunfarms this quarter to C$9.1 million, a record since our Retail Branded Sales launch, and further evidence of the importance of our large-scale, low-cost cultivation capabilities combined with an exceptional management team and the right brand and product strategy.”
“Pure Sunfarms remains well positioned to be the long-term market leader in the Canadian cannabis market as many industry participants continue to shift their strategies or combine businesses in an attempt to compete successfully. Our continued market share, leadership and growth, including our first ever quarter as the top-selling* Licensed Producer in Ontario, gives us even more confidence that we will achieve our stated goal of 20% market share in dried flower in Canada.”
“The continued strong momentum in Retail Branded Sales further underscores the value of our initial focus on the dried flower category. The dried flower market, including pre-rolled products, still comprises more than 70%* of total retail sales, with second quarter dollar-value growth five-times that of the three largest 2.0 categories. With expected continued sales momentum going forward, and in view of potential growth opportunities, we have expanded our capacity by 50% and plan to begin cultivation in the completed half of Delta 2, our second, and now fully licensed, 1.1 million square-foot greenhouse facility next month. We continue to look forward to adding the second half of Delta 2 to our capacity next year, and have an additional 2.4 million square feet of production area on the same site at our Delta 1 facility that can be rapidly converted to cannabis production as the Canadian legal cannabis market continues to grow.”
“In the United States, we are encouraged by the federal cannabis bill recently brought forward by Senate leadership and view it as an integral step in the process of regulatory change that would allow Village Farms to participate in the high-THC cannabis market in the U.S. We have identified multiple potential pathways to participate in the U.S. high-THC cannabis market and continue to refine multiple strategies that will enable us to move swiftly and aggressively to leverage our tremendous cannabis success in Canada for the largest cannabis market in the world, including strategies that could see us enter the U.S. market in advance of converting our Texas operations. We are optimistic that we will continue to see substantive progress in the months to come and are planning accordingly. With the benefit of having now operated our Canadian cannabis business for several years, we expect our Texas greenhouse operations can represent at least a $1 billion sales opportunity in cannabis to Village Farms.”
“Finally, we expect our Produce business to normalize toward the end of this year with indications that prices are trending back to historical levels, as production volumes have improved throughout 2021. Our Texas produce greenhouse operations, with a replacement value in excess of $300 million, and located in one of the best growing environments for cannabis in the continental United States, represent one of our potential pathways to participate in the U.S. high-THC cannabis market. We continue to operate and manage these facilities for this optionality.”
Pure Sunfarms’ Second Quarter and Other Recent Highlights
(Dollar Amounts are Before Village Farms’ Proportionate Share)
- Achieved 135% year-over-growth and 22% sequential growth in Retail Branded Sales, marking the fourth consecutive quarter of sequential growth in Retail Branded Sales;
- Achieved 70% year-over-year growth and 38% sequential growth in total net sales;
- Achieved 40% gross margin as the Delta 3 greenhouse facility operated at full capacity during the quarter;
- Achieved 192% sequential growth and 264% year-over-year growth in Adjusted EBITDA to C$9.1 million (US$7.4 million), a record since the launch of its retail branded products in late 2019 and the 11th consecutive quarter of positive Adjusted EBITDA;
- Was the top-selling brand* of dried flower products with the Ontario Cannabis Store (“OCS”) (by kilograms sold and dollars sold) for the quarter ended June 30, 2021 and remained the top-selling brand of dried flower products with the OCS (by kilograms sold and dollars sold) for the 21-month period since its retail branded sales launch in October 2019;
- Was the top-selling Licensed Producer** of dried flower products with the OCS (by kilograms sold and dollars sold) for the quarter ended June 30, 2021;
- Was the top-selling brand of dried flower products*** in Alberta for the quarter ended June 30, 2021 and monthly since October 2020 (by dollars sold);
- Was the top selling brand of dried flower products*** in British Columbia for the quarter ended June 30, 2021 and monthly since October 2020 (by dollars sold); and,
- Received from Health Canada an amendment to the cultivation license for its second greenhouse facility, the 1.1 million square foot Delta 2 facility, (adjacent to the Delta 3 facility), permitting Pure Sunfarms to begin cultivating cannabis in the currently completed half of the Delta 2 facility, which it expects to do in September, with harvests expected to begin in November of this year.
| *Based on OCS market data for the quarter ended June 30, 2021. |
| **Market share performance and data cited has been calculated by Pure Sunfarms from sales information provided by OCS as of June 30, 2021. |
| ***Market share performance data cited has been calculated by Pure Sunfarms from sales information provided by Buddi retail store data from over 300 retailers across Alberta and British Columbia as of June 30, 2021. |
Pure Sunfarms’ Financial Summary for the Three and Six Months Ended June 30, 2021 and June 30, 2020 (Before Village Farms’ Proportionate Share)
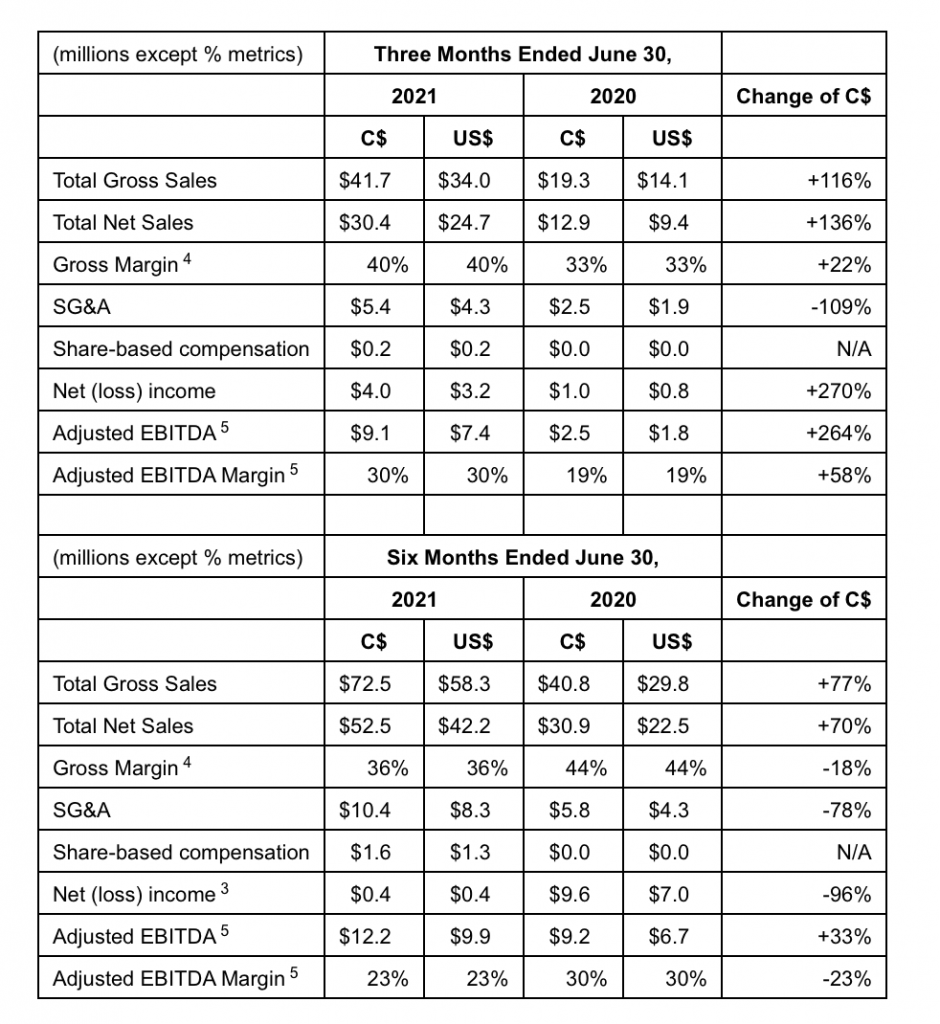
| Net income includes C$6,044 (US$4,348) of debt forgiveness income as an outcome of the “Settlement Agreement” in March 2020 between Pure Sunfarms, Emerald Health Therapeutics and the Company. | |
| 4. | Gross margin for the three months and six months ended June 30, 2021 excludes the C$145 (US$133) and C$3,824 (US$3,058), respectively, inventory adjustment charge from the revaluation of inventory to fair value at the acquisition date of November 2, 2020. |
| 5. | Adjusted EBITDA is not a recognized earnings measure and does not have a standard meaning prescribed in by GAAP. See “Non-GAAP Measures” below. |
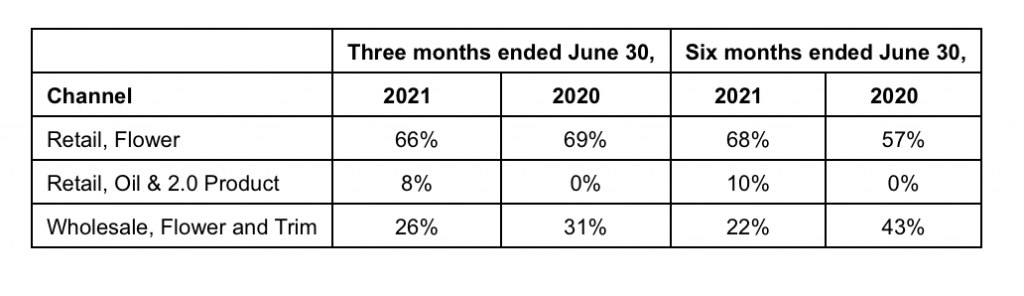
Pure Sunfarms’ Percent of Sales by Product Group
Village Farms’ Second Quarter and Other Recent Highlights
- Produce sales decreased (4%) with higher production volumes offset by lower pricing as the tomato industry experienced one of the lowest pricing environments for tomatoes-on-the-vine and beefsteak varieties in the past ten years versus strong pricing due to elevated demand amidst pandemic-related restrictions in the second quarter of 2020. There are indications that pricing is moving back to historical levels, however, year-over-year comparisons remain challenging;
- Produce Adjusted EBITDA was a loss of ($3.9) million, which excludes a $1.4 million incremental electricity expense in Texas due to temporarily elevated pricing for a five-day period in February (more than 100- times higher than the prices observed in early 2021 and historical February pricing), the result of power supply constraints resulting from the unprecedented winter storm; and,
- Implemented a normal course issuer bid (“NCIB”) under which the Company may purchase up to 4,062,309 of its common shares (representing approximately 5% of issued and outstanding) beginning May 26, 2021 and terminating May 25, 2022. As of June 30, 2021, the Company had purchased 428,097 Common Shares with an average price of $9.2972 per Common Share and a gross value of $3,980. As of the date of this filing, the Company had purchased 536,052 Common Shares with an average price of $9.3272 per Common Share and a gross value of $5,000.
The Company’s financial statements for the three and six months ended June 30, 2021, as well as the comparative periods for 2020, have been prepared and presented in conformity with accounting principles generally accepted in the United States of America (“GAAP”). On June 30, 2021, Village Farms owned 100% of Pure Sunfarms Corp. (“Pure Sunfarms”), after the acquisition was completed on November 2, 2020. Accordingly, for the three and six months ended June 30, 2021, Pure Sunfarms’ financial results are consolidated with Village Farms’ results. For the three and six months ended June 30, 2020, Pure Sunfarms is accounted for on a proportionate basis within “Equity Earnings from Unconsolidated Entities”.
Village Farms’ Consolidated Financial Summary for the Three and Six Months Ended June 30, 2021 and June 30, 2020and Corporate Highlights
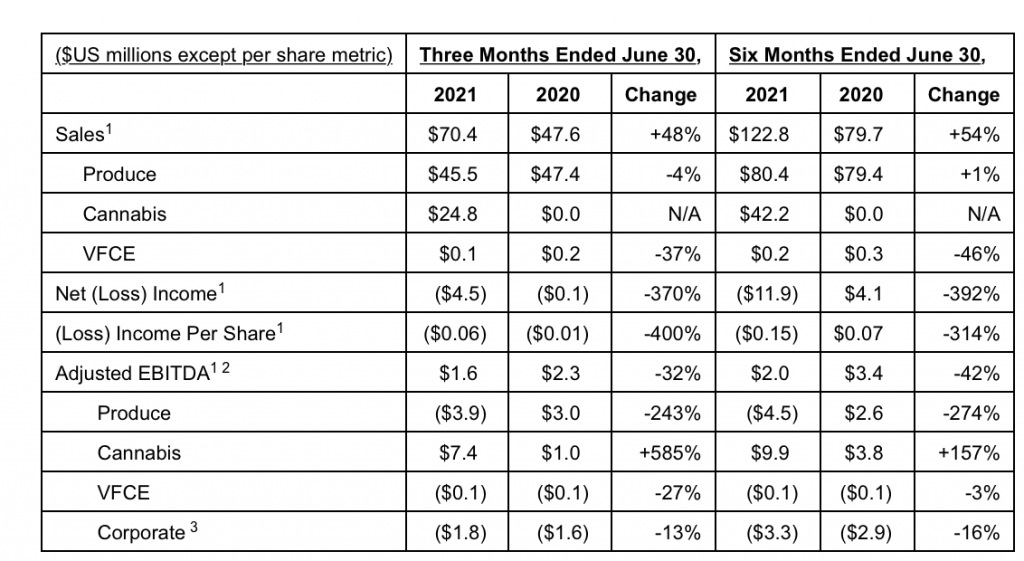
| Sales, Net Income, Income (Loss) per share and Adjusted EBITDA includes results from Pure Sunfarms pursuant to the Company’s statutory reporting requirements. | |
| 2. | Adjusted EBITDA is not a recognized earnings measure and does not have a standard meaning prescribed by GAAP. See “Non-GAAP Measures” below. |
| 3. | Corporate Adjusted EBITDA includes Corporate and Hemp Adjusted EBITDA. See “Reconciliation of Consolidated Net Income to Adjusted EBITDA” below. |
Our Response to the Ongoing Coronavirus Pandemic
In March 2020, the World Health Organization declared the outbreak of the COVID-19 virus a global pandemic. This outbreak continues to cause major disruptions to businesses and markets worldwide as the virus continues to spread. A number of countries as well as certain states and cities within the United States and Canada have enacted temporary closures of businesses, issued quarantine or shelter-in-place orders, and taken other restrictive measures in response to COVID-19. To date, all of our operations are operating normally and abiding by applicable restrictions, however, the extent to which COVID-19 and the related global economic crisis affect our business, results of operations and financial condition, will depend on future developments that are highly uncertain and cannot be predicted, including the scope and duration of the pandemic and any recovery period, future actions taken by governmental authorities, central banks and other third parties (including new financial regulation and other regulatory reform) in response to the pandemic, and the effects on our produce, clients, vendors and employees. We continue to service our customers amid uncertainty and disruption linked to COVID-19 and we are actively managing our business to respond to the impact.
Summary Statutory Results
(in thousands of U.S. Dollars unless otherwise indicated)
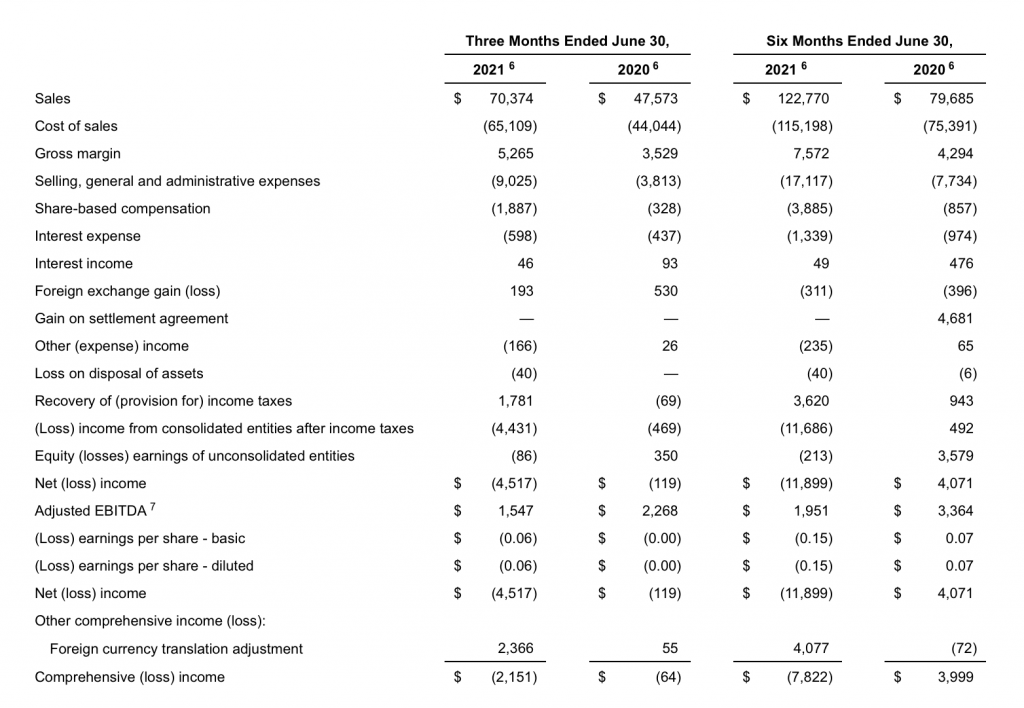
| For the three and six months ended June 30, 2021, Pure Sunfarms is fully consolidated in the financial results of the Company. For the three and six months ended June 30, 2020, Village Farms share of Pure Sunfarms earnings are reflected in equity (losses) earnings of unconsolidated entities. | |
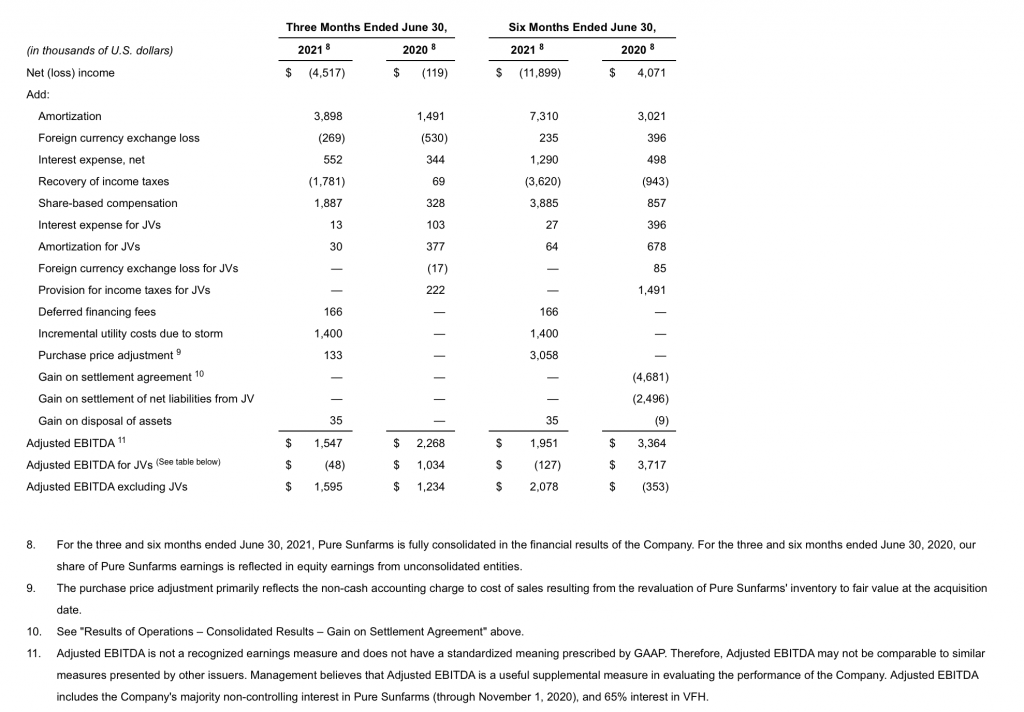
| 7. | Adjusted EBITDA is not a recognized earnings measure and does not have a standard meaning prescribed in by GAAP. Therefore, Adjusted EBITDA may not be comparable to similar measures presented by other issuers. See “Non-GAAP Measures” for a definition and reconciliation of Adjusted EBITDA to net income (loss), the nearest comparable measurement under GAAP. Management believes that Adjusted EBITDA is a useful supplemental measure in evaluating the performance of the Company. Adjusted EBITDA includes the Company’s majority non-controlling interest in Pure Sunfarms (through November 1, 2020), and 65% interest in VFH. |
Discussion of Financial Results
A discussion of our consolidated results for the three and six months ended June 30, 2021 and 2020 is included below. The consolidated results include all three of our operating segments, which include produce, cannabis and clean energy, along with all public company expenses. The remaining 41.3% interest in Pure Sunfarms was acquired by Village Farms on November 2, 2020; for the three and six months ended June 30, 2021, the operating results of Pure Sunfarms are consolidated in our Consolidated Statements of Income (Loss), and for the three and six months ended June 30, 2020, Pure Sunfarms’ results are included in equity earnings from unconsolidated entities in our Consolidated Statements of Income (Loss).
Under “Cannabis Segment Results”, we also present a discussion of the operating results of Pure Sunfarms, before any allocation to Village Farms, which were not consolidated in our financial results for the three and six months ended June 30, 2020 but were consolidated in our results for the three and six months ended June 30, 2021. As a result of the Pure Sunfarms Acquisition, Pure Sunfarms recognized an increase in the fair value of its inventory on-hand on the acquisition date, resulting in a ($133) charge to cost of sales in the second quarter of 2021 and a ($2,925) charge to cost of sales in the first quarter of 2021 from the revaluation of its inventory to fair value. This is a non-cash accounting charge to cost of sales and should be adjusted for when analyzing the actual operational results of Pure Sunfarms.
Consolidated Results
Three Months Ended June 30, 2021 Compared to Three Months Ended June 30, 2020
Sales
Sales for the three months ended June 30, 2021 were $70,374 as compared to $47,573 for the three months ended June 30, 2020. The increase in sales was primarily due to the inclusion of Pure Sunfarms’ Q2 2021 revenues of $24,761 and an increase in produce supply partner sales of $1,867, partially offset by a decrease in our own produce sales of ($3,676) and VFCE power sales of ($151). The produce supply partner sales increase was due to higher volumes of pounds sold of tomatoes, peppers, cucumbers and mini-cucumbers. The decrease in our own produce sales was due to a (42%) decrease in the average selling price of tomatoes in the three months ended June 30, 2021 versus June 30, 2020, partially offset by a 33% increase in our own production volume. The price decrease is the result of a market supply overage caused by lower retailer demand along with an increase in Canadian and U.S. tomato production. The tomato produce industry experienced one of the lowest pricing environments for tomatoes-on-the-vine and beefsteak varieties in the past ten years through late Q2 2021 with signs of pricing moving back into historical ranges towards the end of Q2 2021.
Cost of Sales
Cost of sales for the three months ended June 30, 2021 were $65,109 as compared to $44,044 for the three months ended June 30, 2020. The increase in cost of sales was primarily due to the addition of Pure Sunfarms’ Q2 2021 cost of sales of $14,941, an increase in our produce costs of $4,286, higher produce supply partner costs of $1,319 and an increase in clean energy costs of $519. The Q2 2021 cost of sales for Pure Sunfarms includes a $133 charge from the revaluation of its inventory to fair value at acquisition date and our produce costs include the $1,400 incremental utility charges associated with the Texas freeze of February 2021 that was settled and paid in Q2 2021. The increase in our own production costs was driven by the increase in volume as the Texas facilities improved production cost per pound in Q2 2021 through better utilization of our labor, transportation and handling cost, primarily due to greenhouse management efficiency efforts. The increase in produce supply partner cost of sales was driven by higher volumes of pounds sold and the increase in clean energy costs were driven by higher depreciation charges as the depreciable life of VFCE assets have been accelerated due to the upcoming transition of operations to the Delta RNG Project expected to become operational in the fall of 2022.
Gross Margin
Gross margin for the three months ended June 30, 2021 increased $1,736 to $5,265, or a 7% gross margin, in comparison to $3,529, or a 7% gross margin, for the three months ended June 30, 2020. Excluding the $133 charge from the revaluation of Pure Sunfarms’ inventory to fair value at acquisition date and $1,400 from the incremental Texas freeze utility expenses, gross margin for the three months ended June 30, 2021 increased $3,269 to $6,798, or a 10% gross margin. The positive variance between periods is primarily attributable to Pure Sunfarms’ Q2 2021 gross margin of $9,820 and higher produce supply partner gross margin of $548, partially offset by lower gross margin from our produce operations of ($7,962) and clean energy of ($670).
Selling, General and Administrative Expenses
Selling, general and administrative expenses for the three months ended June 30, 2021 increased $5,212 to $9,025compared to $3,813 for the three months ended June 30, 2020. The increase was primarily due to the inclusion of Pure Sunfarms’ expenses of $4,370, higher produce related legal fees and an increase in corporate expenses, primarily related to public company costs such as investor relations, legal and regulatory fees and incremental costs of U.S. reporting compliance.
Share-Based Compensation
Share-based compensation expenses for the three months ended June 30, 2021 were $1,887 as compared to $328 for the three months ended June 30, 2020. The increase in share-based compensation was primarily due to the vesting of performance shares earned by key corporate and operations employees in Q2 2021 as compared to Q2 2020 and the cost of stock options for Pure Sunfarms’ management of $191 in Q2 2021 versus nil in Q2 2020.
Equity (Losses) Earnings from Unconsolidated Entities
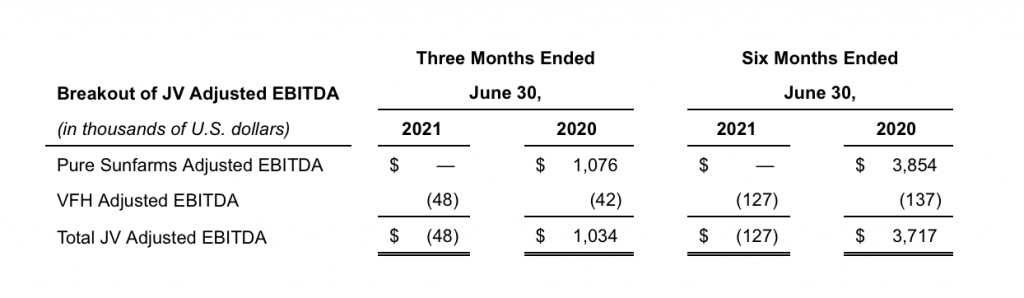
Our share of losses from our joint ventures for the three months ended June 30, 2021 was ($86) compared to earnings of $350 for the three months ended June 30, 2020. The Q2 2021 equity loss includes only our proportionate share of the losses of VFH compared to Q2 2020 which includes our proportionate share of the earnings of Pure Sunfarms and VFH. Our share of income from Pure Sunfarms was presented in equity earnings from unconsolidated entities for the three months ended June 30, 2020. Village Farms began fully consolidating operating results of Pure Sunfarms on November 2, 2020 and its results are presented in the Company’s consolidated operating results for the three months ended June 30, 2021. For information regarding the results of operations from our joint ventures, see “Reconciliation of U.S. GAAP Results to Proportionate Results” below.
Net Loss
Net loss for the three months ended June 30, 2021 was ($4,517) as compared to ($119) for the three months ended June 30, 2020. The increase in net loss was primarily due to a lower gross margin from our produce operations and higher corporate share-based compensation, partially offset by an improved operating profit for Pure Sunfarms in the three months ended June 30, 2021 as compared to June 30, 2020.
Adjusted EBITDA
Adjusted EBITDA for the three months ended June 30, 2021 was $1,547 compared to $2,268 for the three months ended June 30, 2020. The decrease in adjusted EBITDA was primarily due to lower operating results of the produce business, partially offset by the improvement in operating profit for Pure Sunfarms. See the reconciliation of Adjusted EBITDA to net income in “Non-GAAP Measures—Reconciliation of Net Earnings to Adjusted EBITDA”.
Six Months Ended June 30, 2021 Compared to Six Months Ended June 30, 2020
Sales
Sales for the six months ended June 30, 2021 were $122,770 as compared to $79,685 for the six months ended June 30, 2020. The increase in sales was primarily due to the inclusion of Pure Sunfarms’ 2021 revenues of $42,221 and an increase in produce supply partner sales of $6,005, partially offset by a decrease in our own produce sales of ($4,909) and VFCE power sales of ($232). The produce supply partner sales increase was due to higher volumes of pounds sold of tomatoes, peppers, cucumbers and mini-cucumbers, partially offset by lower price per pound for tomatoes and peppers. The decrease in our own produce sales was due to a (30%) decrease in the average selling price of tomatoes in the six months ended June 30, 2021 versus June 30, 2020, partially offset by a 23% increase in our own production volume despite the ongoing virus pressure, primarily from the tomato brown rugose fruit virus, at all of the Texas facilities. The commodity price decrease is the result of a market supply overage caused by an increase in Canadian winter production and a change in retailer buying habits to more specialty tomatoes. The tomato produce industry experienced one of the lowest pricing environments for tomatoes-on-the-vine and beefsteak varieties in the past ten years through late Q2 2021 with signs of pricing moving back into historical ranges towards the end of Q2 2021.
Cost of Sales
Cost of sales for the six months ended June 30, 2021 were $115,198 as compared to $75,391 for the six months ended June 30, 2020. The increase in cost of sales was primarily due to the addition of Pure Sunfarms’ 2021 cost of sales of $30,189, higher produce supply partner costs of $4,600, an increase in our produce costs of $4,143 and higher clean energy costs of $875. The 2021 cost of sales for Pure Sunfarms includes a $3,108 charge from the revaluation of its inventory to fair value at acquisition date and our produce costs include incremental utility charges of $1,400 associated with the Texas freeze of February 2021. The increase in our own production costs was driven by the 23% increase in production volume in the first six months of 2021 versus the first six months of 2020. The increase in produce supply partner cost of sales was driven by higher volumes of pounds sold and the increase in clean energy costs were driven by higher depreciation charges as the depreciable life of VFCE assets have been accelerated due to the upcoming transition of operations to the Delta RNG Project expected to become operational in the fall of 2022.
Gross Margin
Gross margin for the six months ended June 30, 2021 increased $3,278 to $7,572, or a 6% gross margin, in comparison to $4,294, or a 5% gross margin, for the six months ended June 30, 2020. Excluding the $3,108 charge from the revaluation of Pure Sunfarms’ inventory to fair value at acquisition date and $1,400 from the incremental Texas freeze utility expenses, gross margin for the six months ended June 30, 2021 increased $7,786 to $12,080, or a 10% gross margin. The positive variance between periods is primarily attributable to Pure Sunfarms’ 2021 gross margin of $12,032 and higher produce supply partner gross margin of $1,405, partially offset by lower gross margin from our produce operations of ($9,052) and clean energy of ($1,107).
Selling, General and Administrative Expenses
Selling, general and administrative expenses for the six months ended June 30, 2021 increased $9,383 to $17,117compared to $7,734 for the six months ended June 30, 2020. The increase was primarily due to the inclusion of Pure Sunfarms’ expenses of $8,336, higher produce related legal fees and an increase in corporate expenses, primarily related to public company costs such as investor relations, legal and regulatory fees, listing fees for the Toronto Stock Exchange (“TSX”), the January 2021 equity raise and incremental costs of U.S. reporting compliance.
Share-Based Compensation
Share-based compensation expenses for the six months ended June 30, 2021 were $3,885 as compared to $857 for the six months ended June 30, 2020. The increase in share-based compensation was primarily due to the vesting of performance share grants and stock options for Pure Sunfarms’ management of $1,285 in 2021 versus nil in 2020 as well as the vesting of performance shares earned by corporate and operations employees in 2021 as compared to 2020.
Gain on Settlement Agreement
On March 2, 2020, pursuant to the settlement agreement between the Company, Pure Sunfarms and Emerald (“Settlement Agreement”), Emerald transferred to the Company 2.5% of additional equity in Pure Sunfarms. The Company determined the fair value of the equity received from Emerald to be $4,681 (C$6,500). The Company recorded this amount as a gain on non-monetary exchange on the Consolidated Statement of Income (Loss) and Comprehensive Income (Loss) for the six months ended June 30, 2020.
Equity (Losses) Earnings from Unconsolidated Entities
Our share of losses from our joint ventures for the six months ended June 30, 2021 was ($213) compared to earnings of $3,579 for the six months ended June 30, 2020. The 2021 equity loss includes only our proportionate share of the losses of VFH compared to 2020 which includes Pure Sunfarms and VFH. Our share of income from Pure Sunfarms was presented in equity earnings from unconsolidated entities for the six months ended June 30, 2020. Village Farms began fully consolidating operating results of Pure Sunfarms on November 2, 2020 and its results are presented in the Company’s consolidated operating results for the six months ended June 30, 2021. For information regarding the results of operations from our joint ventures, see “Reconciliation of U.S. GAAP Results to Proportionate Results” below.
Net (Loss) Income
Net loss for the six months ended June 30, 2021 was ($11,899) as compared to net income of $4,071 for the six months ended June 30, 2020. The decrease in net income in the six months ended June 30, 2021 as compared to June 30, 2020was primarily due to lower operating profit of the produce operations, higher corporate expenses and accelerating the depreciable life of the clean energy assets due to the upcoming transition of operations to the Delta RNG Project expected to become operational in the fall of 2022.
Adjusted EBITDA
Adjusted EBITDA for the six months ended June 30, 2021 was $1,951 compared to $3,364 for the six months ended June 30, 2020. The decrease in adjusted EBITDA was primarily due to lower operating results from our produce business, partially offset by the improvement in operating profit for Pure Sunfarms. See the reconciliation of Adjusted EBITDA to net income in “Non-GAAP Measures—Reconciliation of Net Earnings to Adjusted EBITDA”.
Foreign Currency Translation Adjustment
The foreign currency translation adjustment for the six months ended June 30, 2021 was $4,077 compared to ($72) for the six months ended June 30, 2020. Village Farms’ functional currency is the U.S. dollar while Pure Sunfarms’ functional currency is the Canadian dollar. The 2021 currency translation adjustment is due to the Canadian dollar strengthening versus the U.S. dollar during the first six months of 2021, as Pure Sunfarms has more Canadian dollar assets than Canadian dollar liabilities on its balance sheet, resulting in a gain on its functional currency when converted on its balance sheet to U.S. dollars.
Cannabis Segment Results – Pure Sunfarms (in C$)
Pure Sunfarms’ comparative analysis are based on the consolidated results of Pure Sunfarms for the three and six months ended June 30, 2021 and June 30, 2020, not accounting for the percentage owned by Village Farms. See “Reconciliation of U.S. GAAP Results to Proportionate Results” for a presentation of Pure Sunfarms’ proportionate results for the three and six months ended June 30, 2021 and June 30, 2020.
Three Months Ended June 30, 2021 Compared to Three Months Ended March 31, 2021
Sales
Pure Sunfarms’ net sales for the three months ended June 30, 2021 were C$30,418 as compared to C$22,092 for the three months ended March 31, 2021. The sequential net sales increase was comprised of a 22% increase in branded sales and a 121% increase in non-branded sales. For the three months ended June 30, 2021, 66% of revenue was generated from branded flower and pre-rolls and 8% of revenue from branded oils, edibles and vapes (“Cannabis Derivate Products”) as compared to 71% of revenue from branded flower and pre-rolls and 13% of revenue from Cannabis Derivative Products for the three months ended March 31, 2021. For the three months ended June 30, 2021, non-branded sales represented 26% of revenues compared to 16% for the three months ended March 31, 2021. The increase in branded sales between sequential periods was largely attributable to increased production of high-potency flower and trim released in the three months ended June 30, 2021. Additionally, many provinces began their COVID-19 re-opening plans as COVID-19 pressures began subsiding and capacity restrictions decreased, particularly in Ontario, which helped spur demand in the latter half of Q2 2021. Similarly, the increase in non-branded sales was largely attributable to the availability of high-potency flower and trim to meet demand from other licensed producers (“LPs”) in the wholesale market.
Cost of Sales
Pure Sunfarms’ cost of sales for the three months ended June 30, 2021 was C$18,328 as compared to C$19,279 for the three months ended March 31, 2021. As a result of the Pure Sunfarms Acquisition, Pure Sunfarms recognized an increase in the fair value of its inventory on the acquisition date, resulting in a (C$145) charge to cost of sales in the second quarter of 2021 and a (C$3,679) charge to cost of sales in the first quarter of 2021 from the revaluation of its inventory to fair value. This is a non-cash accounting charge to cost of sales and should be adjusted for when analyzing the actual operational results of Pure Sunfarms. The decrease in cost of sales between the periods was driven by the lower charge from the revaluation of inventory to fair value at acquisition date. In addition, cost of sales as a percentage of revenue decreased to 60% from 71% for the sequential quarter as our cost or production decreased due to increased yields in cultivation.
Gross Margin
Gross margin for the three months ended June 30, 2021 increased C$9,277 to C$12,090, or a 40% gross margin, in comparison to C$2,813, or a 13% gross margin, for the three months ended March 31, 2021. Excluding the purchase price inventory adjustment of C$145, gross margin for the three months ended June 30, 2021 increased C$5,743 to C$12,235, or a 40% gross margin, in comparison to C$6,492, or a 29% gross margin, excluding the purchase price inventory adjustment of C$3,679 for the three months ended March 31, 2021. The increase in gross margin between sequential periods was attributable to an increase in branded flower sales at higher margins, an increased demand for high-quality, high-potency flower at higher margins for non-branded revenue and lower cost of sales as a percentage of net sales.
Selling, General and Administrative Expenses
Pure Sunfarms’ selling, general and administrative expenses for the three months ended June 30, 2021 were C$5,368, or 18% of sales compared to C$5,024, or 23% of sales for the three months ended March 31, 2021. The decrease in selling, general and administrative expenses as a percentage of sales for the three months ended June 30, 2021 in comparison to the three months ended March 31, 2021 was due to general cost containment efforts initiated by management and a higher percentage increase in sales.
Share-Based Compensation
Share-based compensation expenses for the three months ended June 30, 2021 were C$234 as compared to C$1,392 for the three months ended March 31, 2021. The decrease in share-based compensation is largely due to performance shares granted to Pure Sunfarms’ management that vested in the first quarter of 2021.
Net Income (Loss)
Pure Sunfarms’ net income for the three months ended June 30, 2021 was C$3,988 as compared to a net loss of (C$3,592) for the three months ended March 31, 2021. The higher net income between periods was primarily driven by a higher gross margin due to increased sales volume while decreasing cost of sales and selling, general and administrative expenses as a percentage of revenue.
Adjusted EBITDA
Adjusted EBITDA for the three months ended June 30, 2021 and March 31, 2021 was C$9,125 and C$3,125, respectively, representing an increase of 191%. The increase in Adjusted EBITDA was driven by higher net sales, gross margin and operating profit in the three months ended June 30, 2021 as compared to the three months ended March 31, 2021.
Three Months Ended June 30, 2021 Compared to Three Months Ended June 30, 2020
Sales
Pure Sunfarms’ net sales for the three months ended June 30, 2021 were C$30,418 as compared to C$12,902 for the three months ended June 30, 2020. The net sales increase was comprised of a 154% increase in branded sales and a 96% increase in non-branded sales. For the three months ended June 30, 2021, 66% of revenue was generated from branded flower and pre-rolls and 8% of revenue from Cannabis Derivate Products as compared to 69% of revenue from branded flower and pre-rolls and no sales from Cannabis Derivate Products as Pure Sunfarms launched these products in Q3 2020. The sales increase was due to the impact of store openings throughout Canada combined with favorable brand performance and market share in addition to the launch of Cannabis Derivate Products. Non-branded sales also benefited from store openings and the growth of the Cannabis Derivate Products which in turn increased demand for cannabis biomass sold to other LPs. For the three months ended June 30, 2021, non-branded sales represented 26% of revenues compared to 31% for the three months ended June 30, 2020.
Cost of Sales
Pure Sunfarms’ cost of sales for the three months ended June 30, 2021 was C$18,328 as compared to C$8,594 for the three months ended June 30, 2020. The Q2 2021 cost of sales for Pure Sunfarms includes a C$145 charge from the revaluation of its inventory to fair value at acquisition date. The increase in cost of sales between periods was driven by an increase in net sales, including a higher volume of branded sales which require incremental costs for manufacturing, packaging and distribution. However, cost of sales as a percentage of revenue decreased from 67% to 60% due to increased production efficiencies in 2021.
Gross Margin
Gross margin for the three months ended June 30, 2021 increased C$7,782 to C$12,090, or a 40% gross margin, in comparison to C$4,308, or a 33% gross margin, for the three months ended June 30, 2020. The Q2 2021 gross margin for Pure Sunfarms includes a C$145 charge from the revaluation of its inventory to fair value at acquisition date. The increase in gross margin between periods was primarily due to the higher volume of branded flower and pre-roll sales in 2021.
Selling, General and Administrative Expenses
Pure Sunfarms’ selling, general and administrative expenses for the three months ended June 30, 2021 were C$5,368compared to C$2,574 for the three months ended June 30, 2020. The increase in selling, general and administrative expenses for the three months ended June 30, 2021 in comparison to the three months ended June 30, 2020 was primarily due to additional headcount to support the growth of Pure Sunfarms.
Share-Based Compensation
Share-based compensation expenses for the three months ended June 30, 2021 were C$234 as compared to nil for the three months ended June 30, 2020. The increase in share-based compensation is due to the cost of stock options for Pure Sunfarms’ management.
Net Income
Pure Sunfarms’ net income for the three months ended June 30, 2021 was C$3,988 as compared to C$1,079 for the three months ended June 30, 2020. The higher net income between periods was driven by higher net sales which includes Cannabis Derivative Products sales and lower selling, general and administrative costs as a percentage of net revenue.
Adjusted EBITDA
Adjusted EBITDA for the three months ended June 30, 2021 and June 30, 2020 was C$9,125 and C$2,509, respectively, representing an increase of 264%. The increase in Adjusted EBITDA was driven by higher net sales, gross margin and lower selling, general and administrative costs as a percentage of net sales.
Six Months Ended June 30, 2021 Compared to Six Months Ended June 30, 2020
Sales
Pure Sunfarms’ net sales for the six months ended June 30, 2021 were C$52,510 as compared to C$30,906 for the six months ended June 30, 2020. Branded sales for the six months ended June 30, 2021 and 2020, were C$41,045 and C$17,479, respectively, an increase of C$23,566, or 135% between periods. Non-branded revenue for the six months ended June 30, 2021 and 2020 was C$11,465 and C$13,427, respectively, a decrease of (C$1,962), or (15%). For the six months ended June 30, 2021, 68% of revenue was generated from branded flower and pre-rolls and 10% of revenue was generated from Cannabis Derivate Products as compared to 57% of revenue from branded flower and pre-rolls and no revenue from Cannabis Derivative Products for the six months ended June 30, 2020. The increase in branded sales was largely attributable to increased production of high-potency flower, trim and Cannabis Derivate Products relative to the prior period. Additionally, many provinces began their re-opening plans as COVID-19 pressures subsided and capacity restrictions decreased, particularly in Ontario, which helped spur demand in the latter half of Q2 2021. For the six months ended June 30, 2021, non-branded sales represented 22% of revenues compared to 43% for the six months ended June 30, 2020. The decrease in non-branded sales was largely due to opportunistic and material non-monetary transactions that occurred in 2020 with extraction licensed producers in which Pure Sunfarms sold extraction grade dried flower and trim and purchased various forms of distillate from the same counterparties.
Cost of Sales
Pure Sunfarms’ cost of sales for the six months ended June 30, 2021 was C$37,607 as compared to C$17,201 for the six months ended June 30, 2020. The 2021 cost of sales for Pure Sunfarms includes a C$3,824 charge from the revaluation of inventory to fair value at acquisition date. The increase in cost of sales between periods was driven by an increase in net sales, including the higher volume of branded sales which require incremental costs for manufacturing, packaging and distribution.
Gross Margin
Gross margin for the six months ended June 30, 2021 increased C$1,198 to C$14,903, or a 28% gross margin, in comparison to C$13,705, or a 44% gross margin, for the six months ended June 30, 2020. Excluding the purchase price inventory adjustment of C$3,824, gross margin for the six months ended June 30, 2021 increased C$5,022 to C$18,727, or a 36% gross margin. The increase in gross margin was driven by the increase in branded sales. However, branded sales have a higher cost associated with packaging and distribution which led to a decrease in gross margin as a percentage of revenue between the periods. In addition, Pure Sunfarms entered into certain co-manufacturing agreements to assist in the production of Cannabis Derivative Products which have a lower margin relative to in-house production.
Selling, General and Administrative Expenses
Pure Sunfarms’ selling, general and administrative expenses for the six months ended June 30, 2021 were C$10,392compared to C$5,829 for the six months ended June 30, 2020. The increase in selling, general and administrative expenses for the six months ended June 30, 2021 in comparison to the six months ended June 30, 2020 was primarily due to additional headcount to support the growth of Pure Sunfarms. Selling, general and administrative expenses remained approximately 20% of net sales as revenues increased 70% between the six months ended June 30, 2021 and June 30, 2020, respectively.
Share-Based Compensation
Share-based compensation expenses for the six months ended June 30, 2021 were C$1,626 as compared to nil for the six months ended June 30, 2020. The increase in share-based compensation is due to the vesting of performance share grants and cost of stock options for Pure Sunfarms’ management.
Gain on Settlement of Net Liabilities
Pure Sunfarms recognized income of C$6,044 in the first quarter of 2020 as an outcome of the March 2, 2020Settlement Agreement between Pure Sunfarms, Emerald and the Company. This gain is Pure Sunfarms’ forgiveness of the shareholder loan and accrued interest owed by Emerald offset by the extinguishment of the supply agreement and any amounts receivable thereunder, which included a C$8,100 receivable from Emerald for sales made in 2019.
Net Income
Pure Sunfarms’ net income for the six months ended June 30, 2021 was C$396 as compared to net income of C$9,632for the six months ended June 30, 2020. The decrease in net income was largely attributable to the one-time gain on settlement of net liabilities of C$6,044 in 2020 as well as the lower operating profit for the six months ended June 30, 2021.
Adjusted EBITDA
Adjusted EBITDA for the six months ended June 30, 2021 and June 30, 2020 was C$12,250 and C$9,235, respectively. Adjusted EBITDA increased 33% between periods primarily due to higher gross margin for the period ended June 30, 2021 as compared to June 30, 2020.
Reconciliation of Consolidated Net Income to Adjusted EBITDA
The following table reflects a reconciliation of net income to Adjusted EBITDA, as presented by the Company:
Full results here.

