C21 Investments Inc. (CSE: CXXI) (OTCQX: CXXIF) (“C21” or the “Company”), a vertically integrated cannabis company, today announced unaudited results for its second quarter ended July 31, 2021. All currency reported in U.S. dollars (unless otherwise noted).
Q2 Highlights (May 1, 2021 to July 31, 2021):
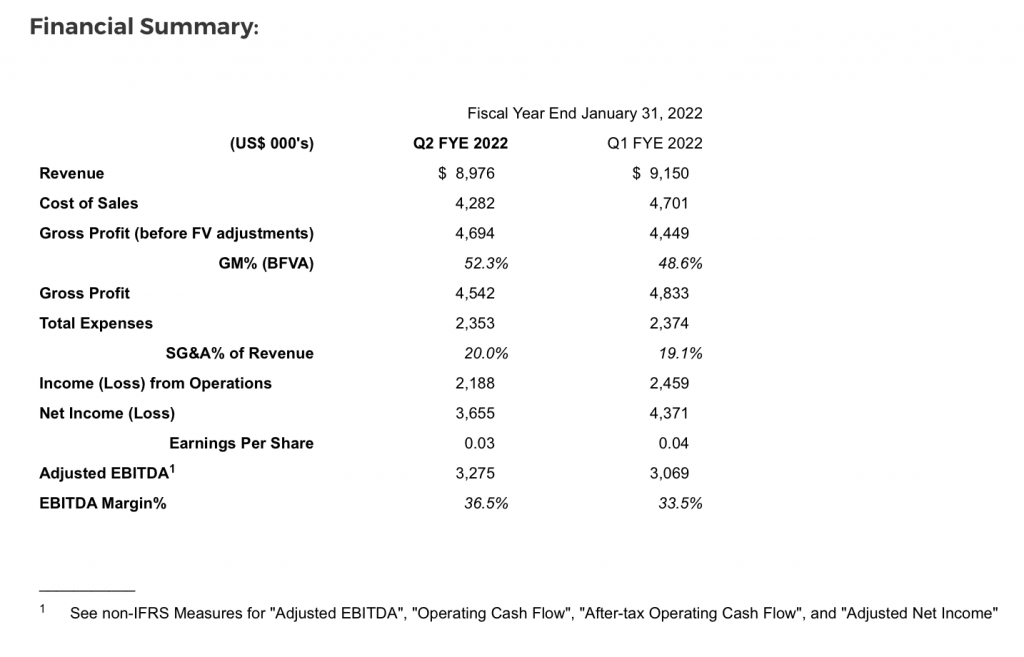
- Revenue of $9.0 million
- Gross Margin (before fair value adjustments) of 52.3% – up 367 basis points from Q1
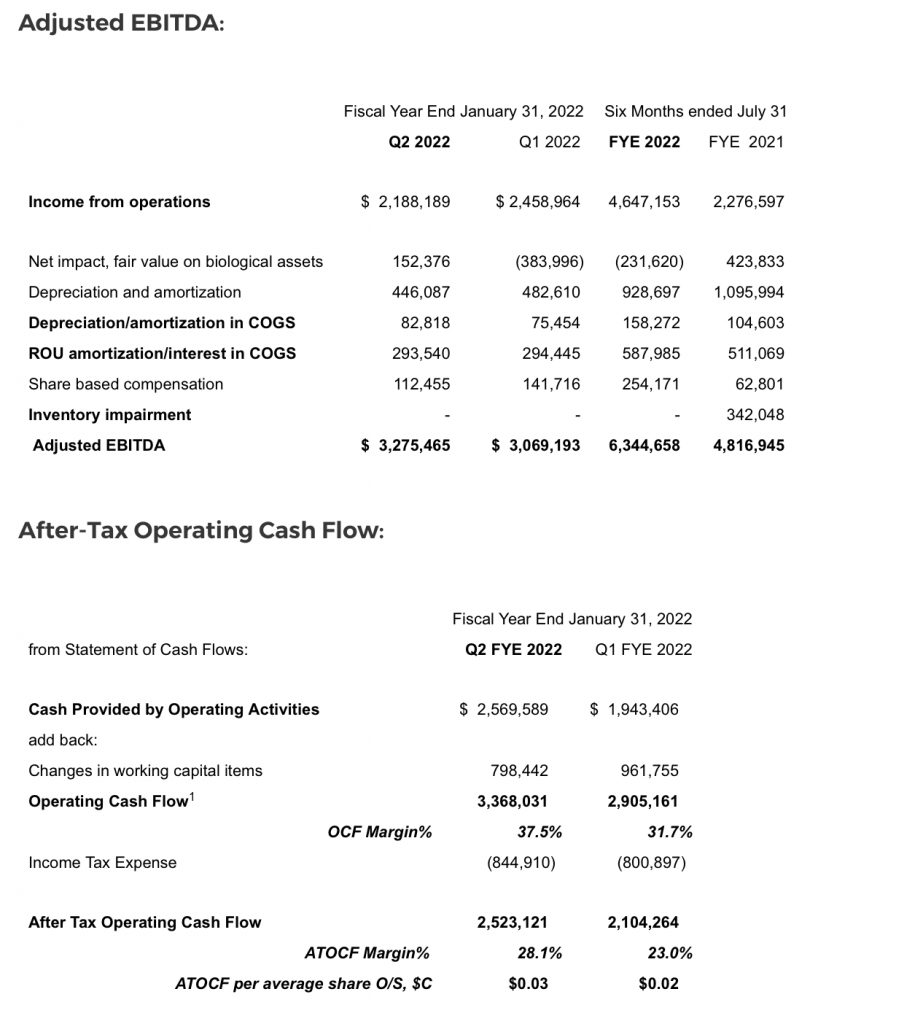
- Operating Cash Flow1 of $3.4 million – up 16% over Q1 – $6.3 million year-to-date
- Adjusted EBITDA1 of $3.3 million – a 36.5% EBITDA Margin – $6.3 million year-to-date
- Net Income of $3.7 million; Earnings Per Share of $0.03 – EPS of $0.06 year-to-date
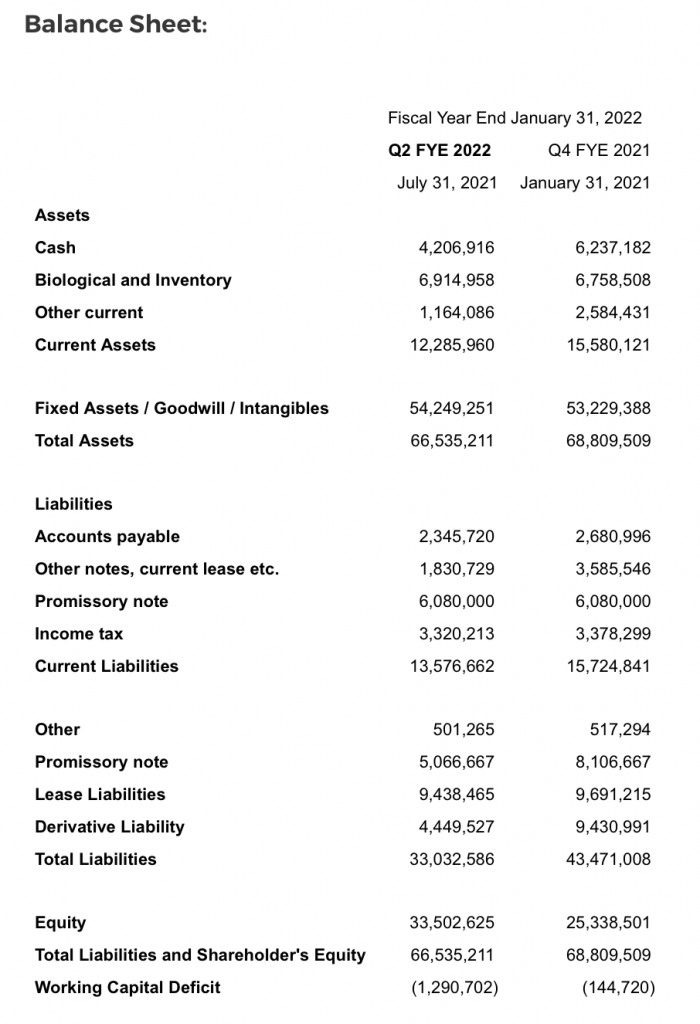
- Total Liabilities reduced by $4.7 million from Q1; $10.4 million in reductions year-to-date
Management Commentary:
“C21 continues to deliver strong, profitable bottom-line performance with one of the leading cash flow margins in the industry. Cash Flow from Operations was up 32% over Q1 resulting in a reported $0.03 in Earnings per Share, and enabling further significant reduction in Total Liabilities,” said Sonny Newman, President and CEO of C21. “We completed our first phase buildout of our cultivation expansion on budget, and expect its first harvest next week, which we anticipate will increase top line results and further strengthen operating margins going forward. We continue to work diligently to deliver greater scale for the Company.”
Q2 Financial Highlights:
Revenue for the second quarter was $9.0 million, down 1.9% from Q1, in line with similar industry trends seen in the Western markets (State of Nevada reported a 6% decline in cannabis sales from April to June 20212). Despite market conditions, C21 remained focused on sustaining the efficiency of its operations, with the Nevada segment continuing to deliver highly profitable results, including $7.8 million adjusted EBITDA year-to-date.
Gross Profit for the quarter was $4.7 million (before fair value adjustments), with Gross Margin of 52.3% (BFVA), up 367 basis points from Q1. The company delivered $3.3 million of Adjusted EBITDA1 for the quarter, up 7% over Q1, and a 36.5% EBITDA Margin. SG&A expenses remained constant at $1.8 million (20% of revenue) for Q2.
Operating Cash Flow1 of $3.4 million (before working capital changes) was reported for the quarter, up 16% over Q1. This cash flow generation enabled C21 to pay down $1.5 million of principle debt, expend $1.2 million of capital to complete the first phase of the cultivation buildout, and pay $0.9 million in Income Tax. Cash Flow from Operations (after working capital changes) was $2.6 million – the ninth consecutive positive quarter – up 32% over Q1, and $4.5 million year-to-date (see Statement of Cash Flows).
The Company reported Net Income of $3.7 million for Q2, or $0.03 Earnings Per Share and $0.06 EPS year-to-date. This included changes in fair value of derivative liabilities (see MD&A). Excluding the changes in derivative liabilities, Adjusted Net Income1 was $1.0 million for Q2, or $0.01 Earnings Per Share.
Cash position at end of the second quarter was $4.2 million, down $1.9 million from the prior quarter reflecting an increase in one-time cash costs, including retirement of a $1.2 million convertible note and the completion of the first phase of cultivation buildout. As a result, Total Liabilities for Q2 were reduced by $4.7 million from last quarter and $10.4 million year-to-date (see Balance Sheet summary provided).
| ___________ | |
| 1 | See non-IFRS Measures below for “Adjusted EBITDA”, Operating Cash Flow”, “After-tax Operating Cash Flow”, and “Adjusted Net Income” |
| 2 | State of Nevada cannabis sales: https://tax.nv.gov/uploadedFiles/taxnvgov/Content/TaxLibrary/NV-Marijuana-Revenue-FY21(7).pdf |
Non-IFRS Measures:
“Adjusted EBITDA”, “Operating Cash Flow”, “After Tax Operating Cash Flow”, and “Adjusted Net Income” are supplemental, non-GAAP financial measures. The Company defines EBITDA as earnings before depreciation and amortization (excluding rent classified as lease amortization), income taxes, and interest. Additionally, the Company’s Adjusted EBITDA presented above excludes fair value adjustments, accretion, impairment charges, one-time transaction costs and all other non-cash items. The Company has presented “Adjusted EBITDA”, “After tax operating cash flow”, and “Adjusted net income” because management believes these are useful measures for investors when assessing and considering the Company’s continuing operations and prospects for the future. Furthermore, “Adjusted EBITDA” is a commonly used measurement in the financial community when evaluating the market value of similar companies. “Adjusted EBITDA”, “After tax operating cash flow”, and “Adjusted Net Income” are not measures of performance calculated in accordance with IFRS, and these metrics should not be considered in isolation of, or as a substitute for, the measurement of the Company’s performance prepared in accordance with IFRS. “Adjusted EBITDA,” as calculated and reconciled in the table above, may not be comparable to similarly titled measurements used by other issuers and is not necessarily a measure of the Company’s ability to fund its cash needs.