C21 Investments Inc. (CSE: CXXI) (OTCQX: CXXIF) (“C21” or the “Company”), a vertically integrated cannabis company, today announced unaudited results for its fiscal year ended January 31, 2021. Upon completion of its auditor’s internal review process, the Company’s audited financials will be filed on SEDAR (www.sedar.com). All currency reported in U.S. dollars (unless otherwise noted).
Fiscal Year Financial Highlights (February 1, 2020 to January 31, 2021):
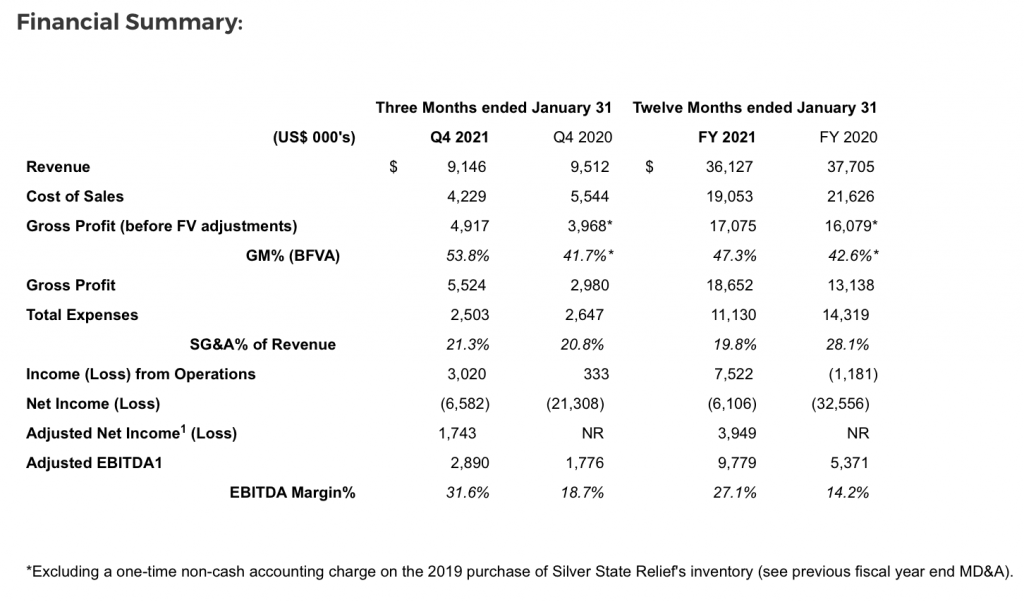
- Revenue of $36.1 million – same store sales in Nevada up 6% despite impact of Q1 state-mandated pandemic restrictions
- Gross Profit of $18.7 million – Gross Margin (before fair value adjustments) of 47%
- Income from Operations of $7.5 million – a $8.7 million improvement over last year
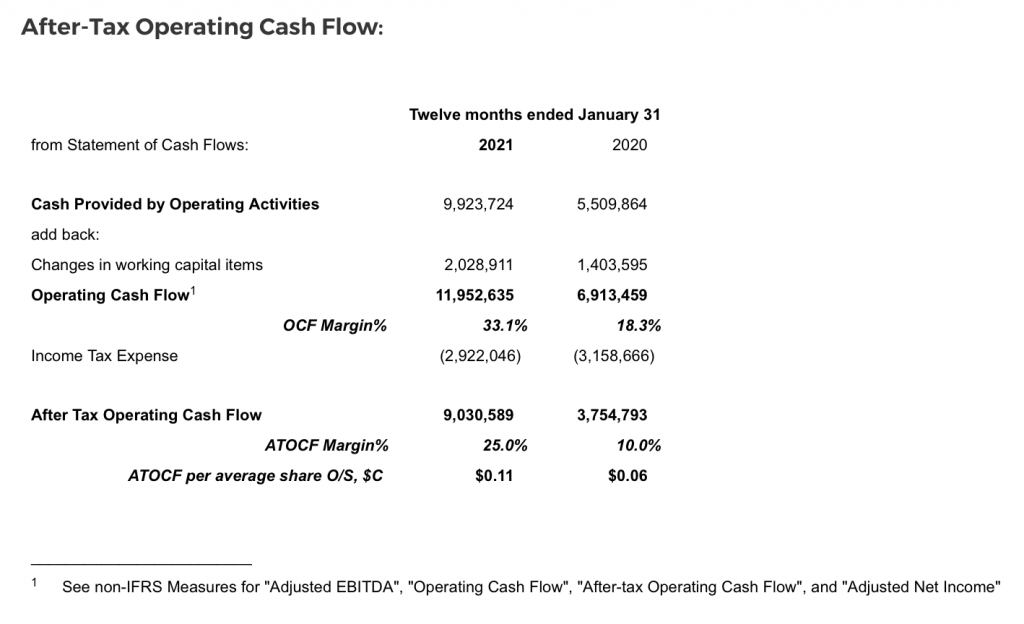
- Operating Cash Flow1 of $12.0 million – up 73% over last year – OCF Margin of 33%
- Working Capital improvement of $27 million
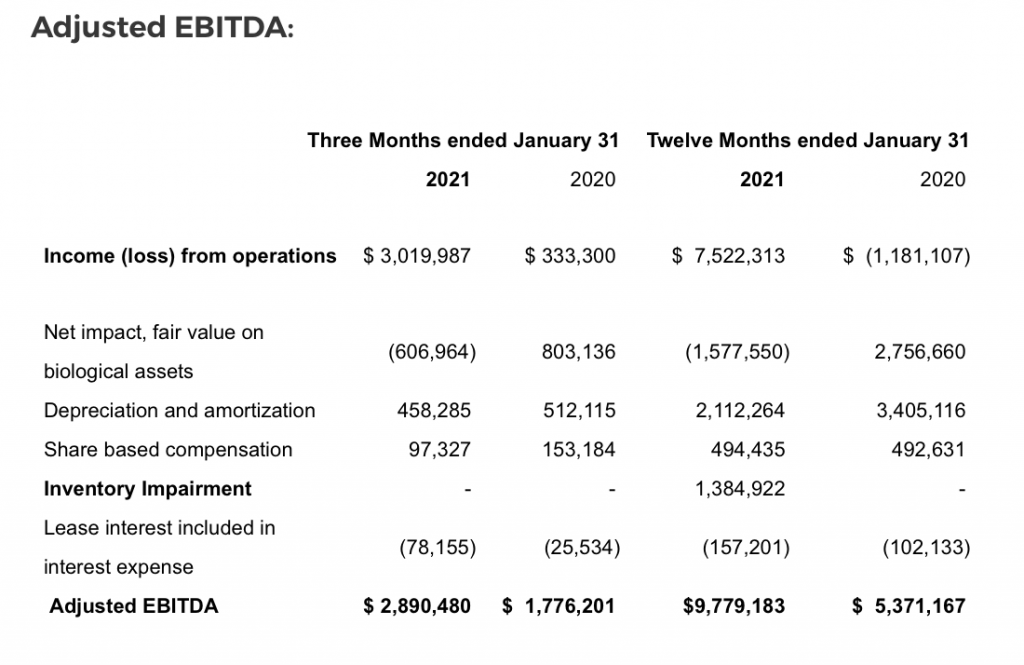
- Adjusted EBITDA1 of $9.8 million – up 82% over last year
Q4 Highlights (November 1, 2020 to January 31, 2021):
- Revenue of $9.1 million – same store sales in Nevada up 10% over Q4 last year
- Gross Profit of $5.5 million – Gross Margin (BFVA) of 54% – up 630 bps over Q3
- Income from Operations of $3.0 million
- Operating Cash Flow[1] of $3.8 million – up 21% over Q3
- Current Liabilities reduced by $19.7 million from last quarter
- Adjusted EBITDA1 of $2.9 million – up 10% over Q3 – a 32% EBITDA Margin
- Announced planned cultivation expansion in Nevada – expects to increase canopy and production capacity by 200%
- Announced divestment of select non-core assets in Oregon
- Appointed Todd Harrison to the Company’s Board of Directors
Management Commentary:
“C21 has delivered strong performance for the fiscal year, generating outsized operating cash flows of $12 million,” said Sonny Newman, President and CEO of C21. “We have transformed our balance sheet by eliminating a $27 millionworking capital deficit. Our relentless focus on execution is clearly delivering results. We have achieved our stated objectives of fortifying our balance sheet and driving efficiency to the bottom line, resulting in significant After-Tax Cash Flow. The evidence is in our numbers. For fiscal 2021, we are reporting an after-tax Operating Cash Flow margin of 25% or C$0.11 per share.”
| _____________________________ | |
| 1 | See non-IFRS Measures below for “Adjusted EBITDA”, Operating Cash Flow”, “After-tax Operating Cash Flow”, and “Adjusted Net Income” |
Mr. Newman added, “Our Q4 results represent a baseline for the profitable, scalable business we have built in Nevada. Looking ahead, we are excited with our Nevada cultivation expansion coming online next month. We are in an excellent position to extend our retail footprint as we work with Needham and Company to pursue accretive growth opportunities.”
2021 Financial Highlights:
Revenue for the year was $36.1 million, down from $37.7 million, reflecting the impact of the sale of Oregon assets during the period. Nevada operations delivered record results with $33.5 million in revenue. Same store sales were up 6% despite the Q1 state mandated in-store shutdowns. The Nevada segment generated a 54% Gross Margin for the year and $12.5 million in Net Income Before Tax.
Gross Profit for the year was $18.7 million, with Gross Margin of 47% (before fair value adjustments). Of note, Q4 Gross Margin was a record 54% (BFVA), driven by stronger performance in Nevada and from the divestment of Oregon assets. This delivered $9.8 million of Adjusted EBITDA1 for the year, up 82% year-over-year.
Operating Cash Flow1 of $12.0 million (before working capital changes) was reported for the year, up 73% from 2020. This cash flow generation enabled C21 to pay down $7.0 million of debt in the period as well as $2.8 million of income tax. Cash Provided by Operating Activities (after working capital changes) was $9.9 million, up 68% year-over-year.
C21 reported Income from Operations of $7.5 million for the year, a $8.7 million improvement over last year, driven by stronger gross margins and reduced operating expenses. SG&A expenses were $7.1 million (20% of revenue) down from $10.4 million (28% of revenue) reflecting management’s continued focus on driving greater efficiency in its operations.
The Company reported a Net Loss of $6.1 million for the year, which was driven by non-cash accounting items of $10 million, including changes in fair value of derivative liabilities (see MD&A). Excluding these non-cash items, Adjusted Net Income1 was $3.9 million for the fiscal year and $1.7 million for Q4.
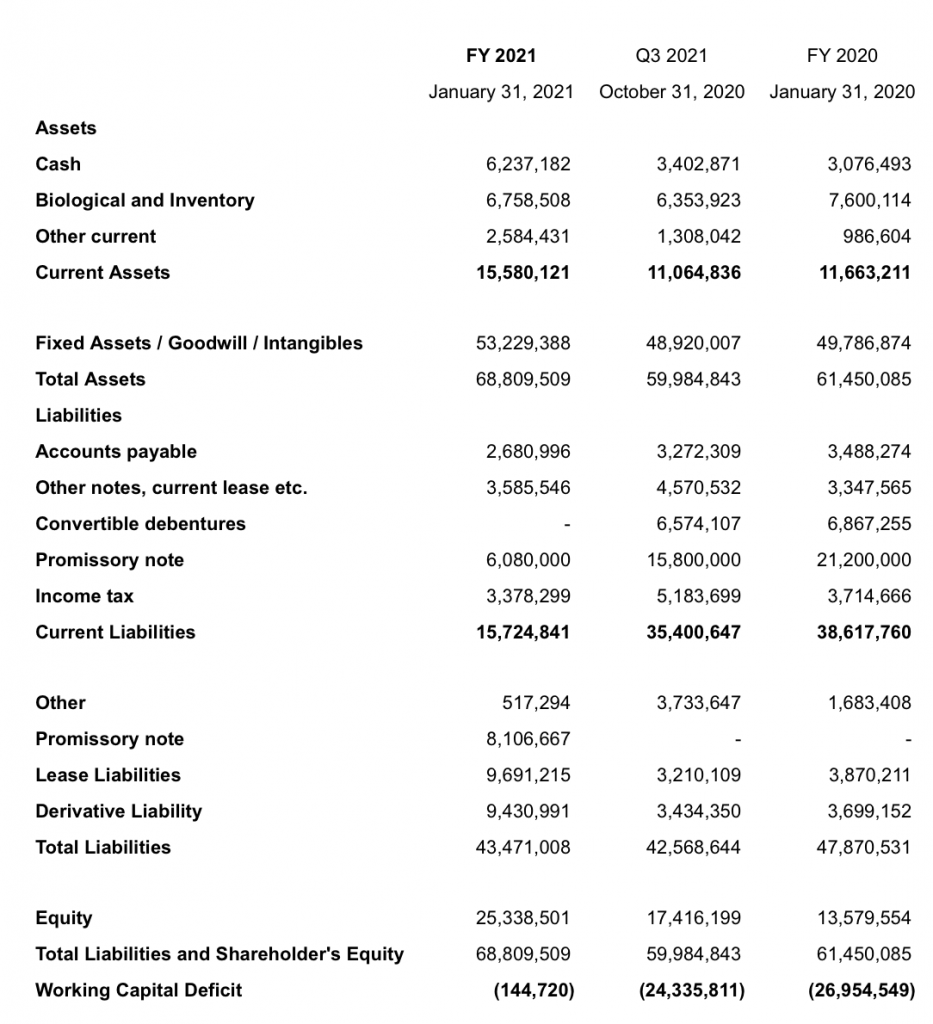
The C21 Balance Sheet reflects the results of restructuring activities in Q4. Working capital improved by $27 million with conversion of debentures in the period and the term out of debt obligations over 30 months. Fortifying the balance sheet provides a strong foundation for growth and better access to capital markets.
Cash position at year end was $6.2 million, up from $3.4 million at the end of Q3. Current liabilities were reduced to $15.7 million from $35.4 million at the end of Q3 (see balance sheet summary provided).
Given the strong financial performance reported for FY 2021, management has announced the removal of the going concern note from its audited financial statements.
| ________________________________ | |
| 1 | See non-IFRS Measures below for “Adjusted EBITDA”, “Operating Cash Flow”, “After-tax Operating Cash Flow”, and “Adjusted Net Income” |
Non-IFRS Measures:
“Adjusted EBITDA”, “Operating Cash Flow”, “After Tax Operating Cash Flow”, and “Adjusted Net Income” are supplemental, non-GAAP financial measures. The Company defines EBITDA as earnings before depreciation and amortization (excluding rent classified as lease amortization), income taxes, and interest. Additionally, the Company’s Adjusted EBITDA presented above excludes fair value adjustments, accretion, impairment charges, one-time transaction costs and all other non-cash items. The Company has presented “Adjusted EBITDA”, “After tax operating cash flow”, and “Adjusted net income” because management believes these are useful measures for investors when assessing and considering the Company’s continuing operations and prospects for the future. Furthermore, “Adjusted EBITDA” is a commonly used measurement in the financial community when evaluating the market value of similar companies. “Adjusted EBITDA”, “After tax operating cash flow”, and “Adjusted Net Income” are not measures of performance calculated in accordance with IFRS, and these metrics should not be considered in isolation of, or as a substitute for, the measurement of the Company’s performance prepared in accordance with IFRS. “Adjusted EBITDA,” as calculated and reconciled in the table above, may not be comparable to similarly titled measurements used by other issuers and is not necessarily a measure of the Company’s ability to fund its cash needs.
Fiscal Year End Balance Sheet: